

Tumor Cell Analysis
The emergence of cancer and metastasis is orchestrated by a vast and complex network of cancer signaling pathways. Depending on the tumor type, the expression and the mutational state of specific oncogenes (e.g., Ras, PI3K, and Myc), tumor suppressor genes (e.g., PTEN, P53, and Rb), and their downstream targets can give important information about the expected patient outcome. To test if a drug is a promising therapeutic, or to analyze the relevance of a gene for a defined tumor type, drug screens or gene knockdown/overexpression experiments are widely performed in cell-based models.
Analyzing the fitness, morphology, and behavior of tumor cells by live cell imaging gives first insights into the efficacy of drugs, antibodies, and other agents as potential novel therapies. In addition, the cellular expression and localization of the encoded proteins of interest after such treatments can be visualized by immunofluorescence staining and high-resolution fluorescence microscopy.
Find Out More
Get more information about the planning, conduction, and data analysis of live cell imaging assays here.
Cell proliferation, cell death, cell survival, and many more aspects can be measured using cell-based assays to serve as readouts for cancer cell fitness. In addition to standard 2D cell assays, cells can be cultured in a three-dimensional setup (e.g., creating spheroids or seeding single cells in a gel matrix). This way, the cellular microenvironment can be mimicked, closely representing the physiological situation. If the initial in vitro results are promising, the agents can later be tested in vivo and, at best, finally translated into the clinic.
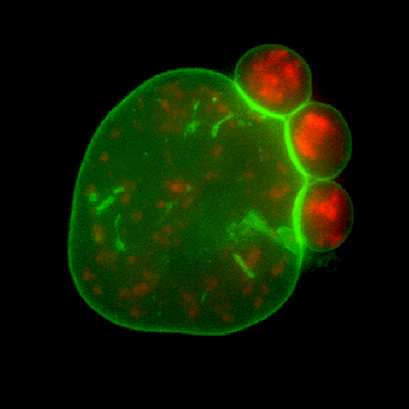
A paw inside the cell. A human bone osteosarcoma (U2OS) cell expressing GFP-tagged nuclear lamina (green) and RFP-tagged alternative splicing factor (red) undergoing nuclear blebbing. The cells were cultured and imaged in an ibidi μ-Dish 35 mm, high Glass Bottom. Data by Mohammad Amin Abolghassemi Fakhree, MESA+ Institute, University of Twente, Enschede, The Netherlands.
Proliferation of healthy mammalian cells is controlled by a complex mechanism including numerous cell cycle regulators, such as cyclins and Cdks. The cell cycle regulation is abrogated in cancer cells, leading to sustained proliferation. Many imaging-based assays have been developed to quantify proliferating cells (e.g., after drug treatment). In two widely used assays, BrdU or EdU are added to the cells, where they incorporate into newly synthesized DNA during proliferation, and thereby can be detected by fluorescence microscopy. Further, immunostaining of proliferation proteins such as PCNA or Ki67 can be used to detect cells that are in an active phase of the cell cycle.
Programmed cell death (apoptosis) functions as a natural barrier to the emergence of cancer by erasing potentially harmful cells. However, tumor cells override this protective mechanism by acquiring resistance to cell death. There are several imaging methods to measure apoptosis on a cellular level. Approaches in which specific fluorescent staining helps to distinguish the dead (or dying) cells from living cells (e.g., Hoechst, FDA-PI, and TUNEL) are widely used in cancer research.
Find Out More
Please find more detailed information about planning and conducting immunofluorescence assays here.
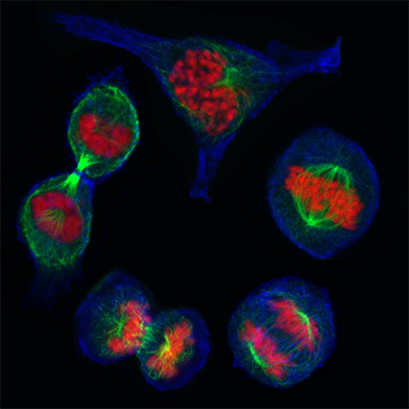
MCF7 breast cancer cells during the different stages of mitosis. Cells were grown on an ibidi Glass Bottom Dish 35 mm and stained with phalloidin (blue) to visualize F-actin, α-Tubulin for the mitotic spindle (green), and DAPI (red) for DNA. Cells were visualized on a NIKON A1R scanning laser confocal microscope using a 60x objective. Data by Olga Tapia, (Health Research Institute Valdecilla (IDIVAL)) and Almudena Medina (Dept. Anatomy & Cell Biology), University of Cantabria, Santander, Spain.
ibidi Solutions for Tumor Cell Analysis
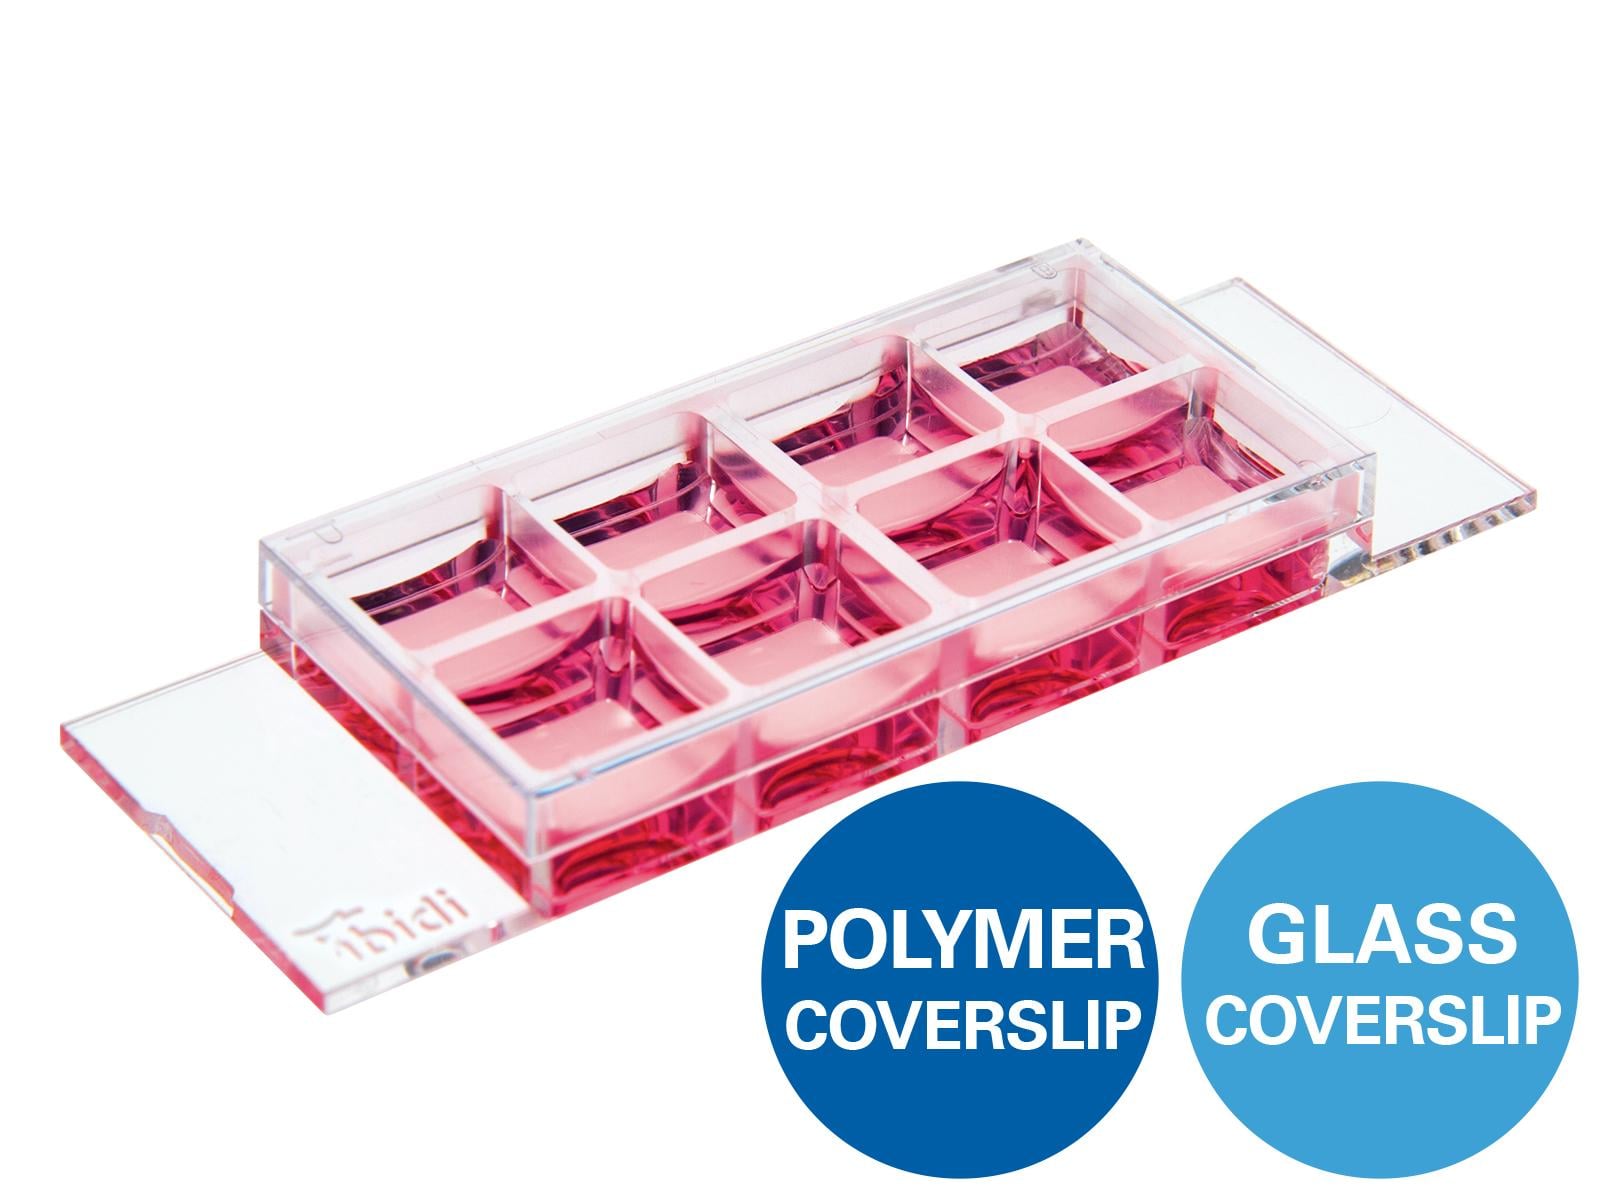
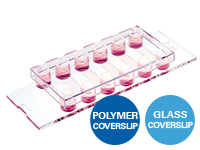
The ibidi µ-Slides and µ-Dishes include different geometries that combine optimal conditions for everyday cell culture and functional cell-based assays. They are ideal for immunofluorescence, live cell imaging, and high-resolution microscopy. The ibidi labware is available with the ibidi Polymer Coverslip and the ibidi Glass Coverslip. |
|
The ibidi channel slides, especially the µ-Slide VI 0.4, are particularly suitable for immunofluorescence stainings: Their geometry is ideal for the exact exchange of small medium amounts, which is necessary during immunocytochemistry stainings, making the channel geometry ideal for low-volume immunofluorescence assays. |
|
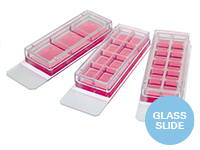
The Chamber Slides, removable are ideal for both low- and high-throughput immunofluorescence experiments and are suitable for the long-term storage of samples that are mounted with a glass coverslip. |
|
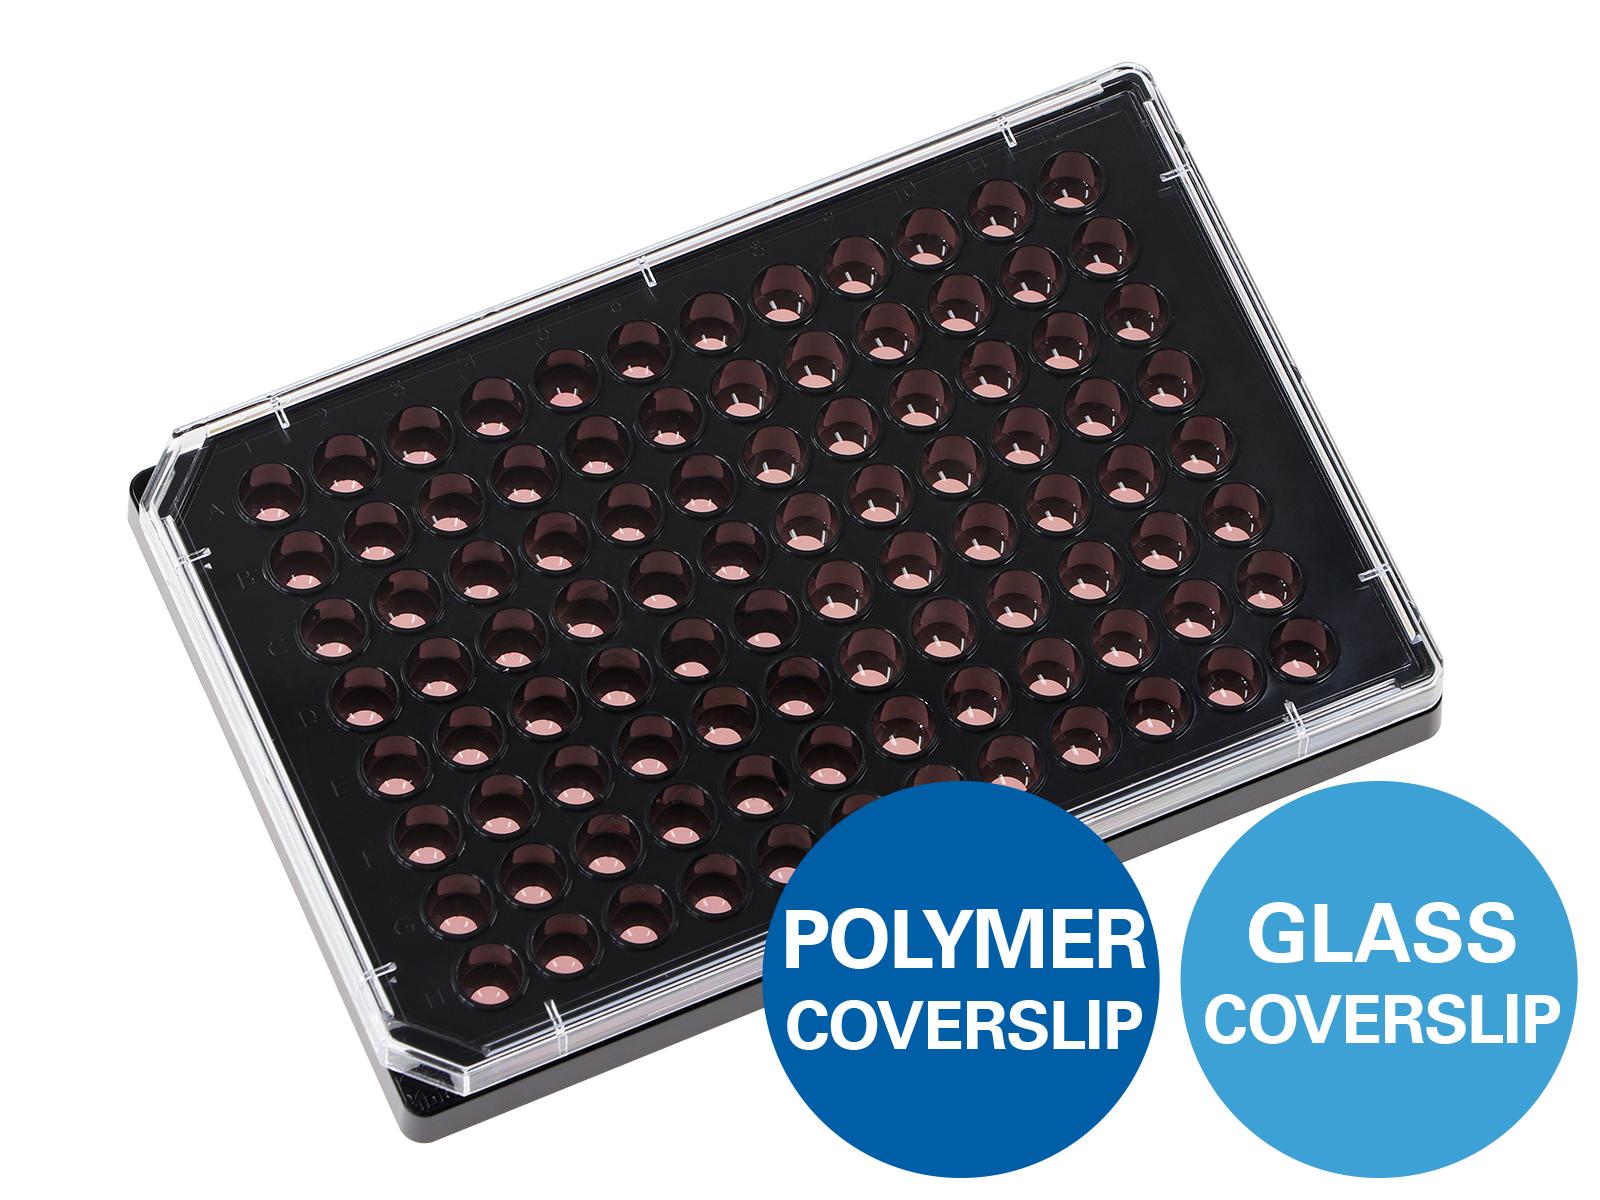
The ibidi µ-Plates are ideal for high throughput drug screening and large-scale knock-down and overexpression experiments with high-resolution microscopy as readout. These imaging plates are compatible with robotics and plate readers due to an ANSI/SLAS (SBS) standard format. The ibidi µ-Plates have 24, 96, or 384 wells and are available with the ibidi Polymer Coverslip and the ibidi Glass Coverslip with extremely low autofluorescence for undisturbed fluorescence microscopy. |
|
The ibidi Mounting Medium and the ibidi Mounting Medium With DAPI for immunofluorescence have a very low autofluorescence, prevent photobleaching and allow the sample to be stored for several weeks on the µ-Slide without the need for additional coverslips. |
|
The ibidi Stage Top Incubators provide physiological conditions for live cell imaging on every standard inverted microscope. They include CO2 and O2 control (e.g., for hypoxia experiments) and actively controlled humidity. They are available for single slides and dishes as well as for multiwell plates. |
|


Selected References
Bioprinting of several cancer cell lines in the ibidi µ-Dish 35 mm, low and µ-Dish 50 mm, low to establish a simple 2D tumor model including microenvironment
Jeffries, G. D. M., Xu, S., Lobovkina, T., Kirejev, V., Tusseau, F., Gyllensten, C., Singh, A. K., Karila, P., Moll, L., & Orwar, O. (2020). 3D micro-organisation printing of mammalian cells to generate biological tissues. Scientific Reports. 10.1038/s41598-020-74191-w
Read article
Live cell imaging of dormant prostate cancer cells at single-cell level in the µ-Dish 35 mm Quad to analyze cell division
Yu-Lee, L. Y., Yu, G., Lee, Y. C., Lin, S. C., Pan, J., Pan, T., Yu, K. J., Liu, B., Creighton, C. J., Rodriguez-Canales, J., Villalobos, P. A., Wistuba, I. I., de Nadal, E., Posas, F., Gallick, G. E., & Lin, S. H. (2018). Osteoblast-Secreted Factors Mediate Dormancy of Metastatic Prostate Cancer in the Bone via Activation of the TGFβRIII–p38MAPK–pS249/T252RB Pathway. Cancer Research. 10.1158/0008-5472.CAN-17-1051
Read article
Quantification of circulating tumor cells in the µ-Slide 8 Well
Lüönd, F., Sugiyama, N., Bill, R., Bornes, L., Hager, C., Tang, F., Santacroce, N., Beisel, C., Ivanek, R., Bürglin, T., Tiede, S., van Rheenen, J., & Christofori, G. (2021). Distinct contributions of partial and full EMT to breast cancer malignancy. Developmental Cell. 10.1016/J.DEVCEL.2021.11.006
Read article