Data Analysis of Chemotaxis Assays
Data Plotting > Quantitative and Statistical Analysis > Data Interpretation

Data Plotting
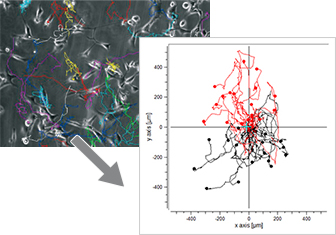
After tracking, the paths of the cells can be visualized in trajectory plots that will already give information about the chemotactic effects. This is usually done using special software.
In a trajectory plot, all (x,y) coordinates of the cells' starting points are set to (0,0) using a coordinate transformation. With this setting, the general direction of cell migration is displayed and allows for first data interpretations. To finally confirm whether or not the observed cell migration is chemotactic or random, the data must be statistically analyzed.
ibidi Solutions
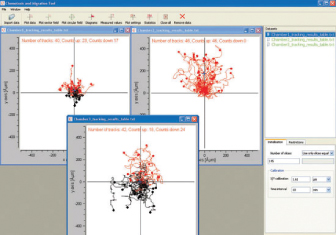
The Chemotaxis and Migration Tool allows for the fast and easy creation of cell trajectory plots, as well as subsequent statistical analysis. For a better visualization of the chemotaxis effects, additional information can be displayed in the plots (e.g., color information of cells moving up/down, center of mass, and cell endpoints). All data can be exported for further analysis. The tool is freely available for download here.
In order to analyze and interpret chemotaxis assays correctly, it is necessary to know the meaning and calculation of the relevant chemotaxis parameters.
The most important parameter for quantifying chemotactic cell migration is the Forward Migration Index (FMI┴, FMI II). A further measure of directed cell migration is the Center of Mass (Mend). Additionally, we recommend the Rayleigh test, which statistically determines if the cell distribution is homogeneous or inhomogeneous.
Further migration parameters are the Directness (D) and the cell speed/velocity, which, however, may not necessarily indicate a chemotaxis effect. All these relevant chemotaxis values can be automatically calculated by using the Chemotaxis and Migration Tool.
Zengel P, et al. (2011) μ-Slide Chemotaxis: a new chamber for long-term chemotaxis studies. BMC Cell Biol 10.1186/1471-2121-12-21.
read abstract
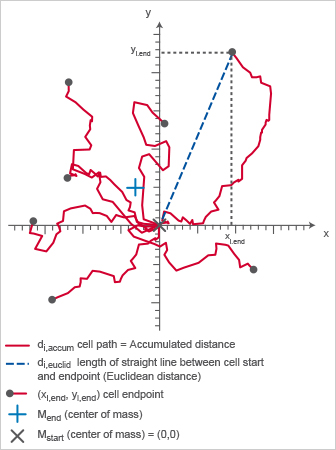
Chemotaxis plot displaying important chemotaxis parameters.
Forward Migration Index (FMI┴, FMI II)
The Forward Migration Index (FMI) is an important measure for directed, chemotactic cell migration. It represents the efficiency of the forward migration of cells.
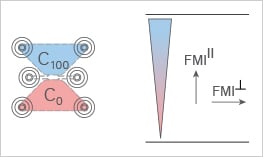
For FMI calculation, it is necessary to define the direction of the x-axis and the y-axis in relation to the chemotactic gradient. Here, we define the x-axis as perpendicular to the gradient (┴) and the y-axis as parallel to the gradient (║).
To determine if directed cell migration occurs in a chemotaxis assay, two FMI values have to be calculated:
- FMI┴ (xFMI) describes the forward migration of cells in a direction perpendicular to the gradient
- FMI II (yFMI) describes the forward migration of cells in a direction parallel to the gradient
The larger the FMI┴ or the FMI II, the stronger the chemotactic effect is on the x-axis or y-axis, respectively.
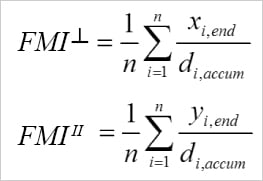
Calculation of the FMI┴ and the FMI II. i = index of single cells, n = number of cells, xi,end, yi,end = coordinates of the cells' endpoints, di,accum = accumulated distance of the cells' paths.
Rayleigh Test
The Rayleigh test is a statistical test for the uniformity of a circular distribution of points (cell endpoints).
With p < 0.05, the null hypothesis (uniformity) is rejected, indicating a chemotaxis effect. Like all statistical tests, this one strongly depends on the number of analyzed cells. The Rayleigh test for vector data also includes the distance from the origin.
Moore BR., 1980, A modification of the Rayleigh test for vector data, Biometrika, Volume 67, 175-180
The center of mass represents the average of all single cell endpoints. Its x and y values indicate the direction, in which the group of cells primarily traveled.

Calculation of the center of mass (Mend). i = index of single cells, n = number of cells, xi,end, yi,end = coordinates of the respective cell endpoint.
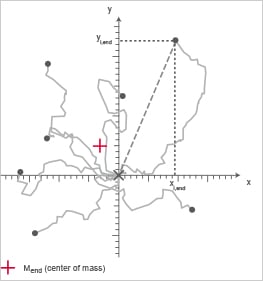
Chemotaxis plot; the Center of Mass is indicated in red.
The directness (sometimes also called directionality) is a measure of the straightness of the cell trajectories.
It is calculated by comparing the Euclidean distance (di,euclid) and the accumulated distance (di,accum) between the starting point and the endpoint of a migrating cell.
The directness values are always positive. A directness of D = 1 equals a straight-line migration from the start to the endpoint.

Calculation of the directness (D) of one single cell. i = index of the single cell, di,euclid = Euclidean distance, di,accum = accumulated distance.

Averaged directness of all cells in an experiment.
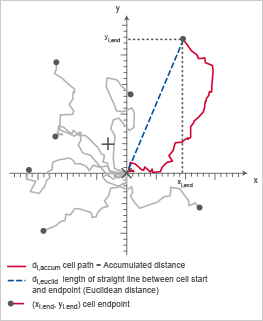
Chemotaxis plot indicating di,accum (red) and di,euclid (blue), which are important to calculate the directness (D).

Four examples of cell directness. A directness value approaching 0 indicates indirect, curvy cell migration. A directness value tending towards 1 indicates a straight migration from the start to the endpoint. Note, that the cell endpoints are identical in this example.
ibidi Solution
- The Chemotaxis and Migration Tool provides chemotaxis plots, graphs, and statistical tests for the advanced analysis of chemotaxis assays. All relevant chemotaxis parameters are automatically calculated. All data can be exported for further analysis. The tool is freely available for download here.
Data Interpretation
The following criteria must be fulfilled to determine directed, chemotactic cell migration and to exclude biased migration by non-chemotactic environmental factors:
- The FMI II of the experimental group (+/-) must be significantly higher than the FMI II of the respective positive (+/+) and negative (-/-) control groups
- The FMI II of the experimental group must be significantly higher than the corresponding FMI┴, which must be close to zero
- The FMI┴ and the FMI II of the control groups (+/+, -/-) must be close to zero
- The Rayleigh test of the experimental group must result in p < 0.05 (significant)
- The Rayleigh test of the control groups must result in p > 0.05 (not significant)
If these criteria are not fulfilled, the cell migration must be considered as random and non-directed.
Please have a closer look at our Example Chemotaxis Data. Or read on and learn more about Chemotaxis in Cell Physiology, different Chemotaxis Assays, or the Experimental Workflow of a Chemotaxis Assay.


