The ibidi µ-Patterning Technology
Achieve Precise Spatial Control Over Cell Adhesion With ibidi Micropatterning
The ibidi µ-Patterning technology enables spatially defined cell adhesion for various 2D and 3D cell culture applications.
Miniaturized adhesive patterns (e.g., squares or dots) are irreversibly printed on the non-adhesive Bioinert surface of the ibidi Polymer Coverslip, allowing for precisely controlled cell adhesion. The µ-Patterns are dry-stable, sterile, and ready to use.
The µ-Pattern, the Bioinert surface, and the ibidi Polymer Coverslip are all optimized for high resolution imaging and microscopy.
What Is Micropatterning?
Micropatterning is a technique used to create defined micro-scale structures or functional areas on a surface. In biological research, it is commonly used to control where biomolecules, extracellular matrix proteins, or cells are positioned. This makes it possible to design surfaces with specific adhesive and non-adhesive regions for controlled experimental conditions.
In cell culture, micropatterning defines where cells can adhere, spread, and grow on a surface. Instead of allowing cells to attach randomly, adhesive areas are arranged in precise geometries, while the surrounding surface remains non-adhesive. This enables spatial control over cell position, cell shape, cell density, and cell–cell interactions.
Micropatterned surfaces can be generated by different techniques, such as microcontact printing or structured illumination, or provided as ready-to-use labware, such as ibidi Micropatterned Labware.
Depending on the pattern geometry, cells can be cultured as isolated single cells, defined multi-cell clusters, aligned structures, or organized 3D microtissues.
What Is Micropatterning Used For?
Micropatterning is used to control the spatial organization of cells in cell-based assays. By defining the adhesive area, researchers can standardize how cells attach, spread, align, or interact with neighboring cells. This makes micropatterning a valuable tool for experiments that require reproducible cell positioning and reliable microscopy readouts.
Typical applications include single-cell analysis, spheroid generation, cell morphology studies, cell polarity assays, cytoskeletal organization, cell migration, neurite outgrowth, and controlled cell–cell interaction studies.
Micropatterning is also suitable for advanced imaging workflows, including fluorescence microscopy, immunofluorescence staining, live cell imaging, and time-lapse analysis. Because cells are positioned in predefined areas, image acquisition and quantitative image analysis can become more efficient, especially in screening-like assays or experiments with many comparable conditions.
The Principle of the ibidi µ-Patterning Technology
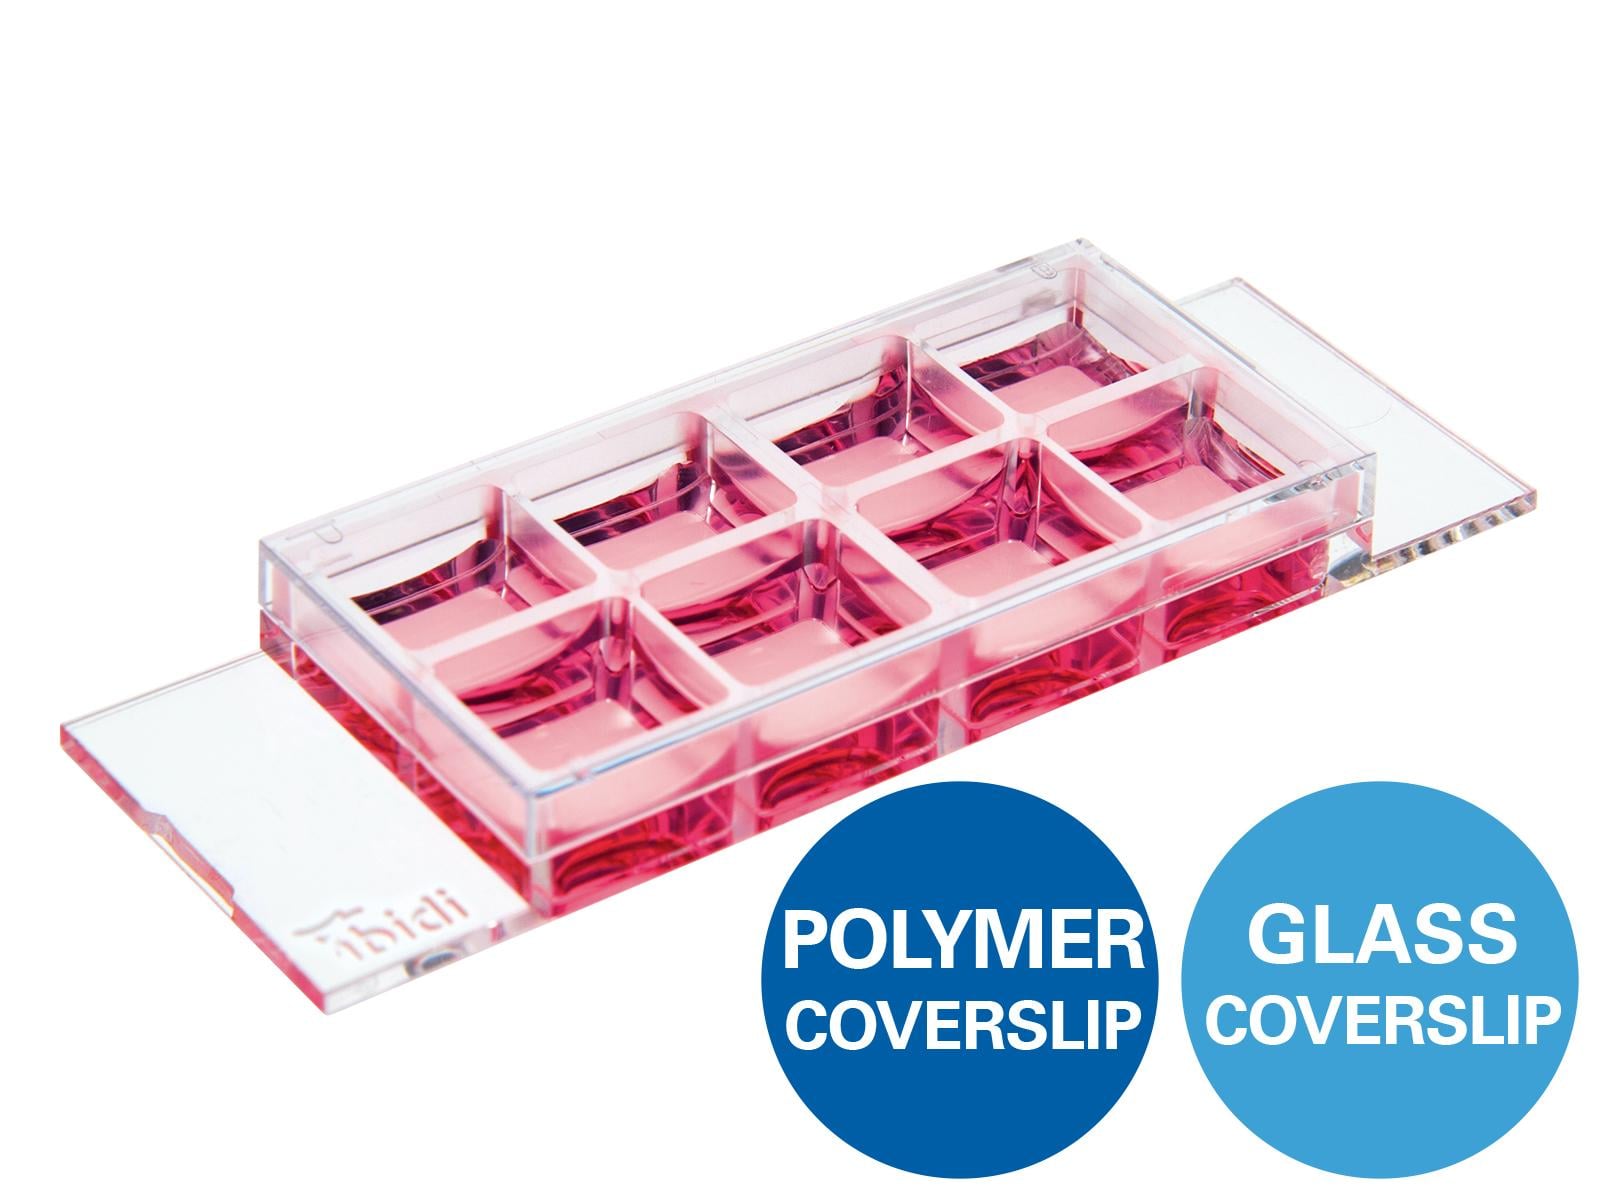
The ibidi µ-Patterning technology provides spatially defined cell adhesion for various spheroid and organoid applications. The miniaturized, adhesive patterns are irreversibly printed in the non-adhesive Bioinert surface of the ibidi Polymer Coverslip, which allows for precisely controlled cell adhesion. The µ-Patterns are dry-stable, sterile, and ready to use. The ibiTreat µ-patterns are slightly visible under the phase contrast microscope but not visible using fluorescence microscopy.
ibiTreat is the hydrophilic, tissue culture-treated (TC-treated) version of the ibidi Polymer Coverslip. This physical surface modification, which is comparable to the tissue culture treatment of standard cell culture vessels, makes the surface hydrophilic and adhesive to virtually all cell types.
Specific protein coatings on ibiTreat are easily possible, similar to our non-patterned ibiTreat µ-Slides.
The µ-Pattern, the Bioinert surface, and the ibidi Polymer Coverslip are all optimized for high-resolution imaging and microscopy.
Application Examples
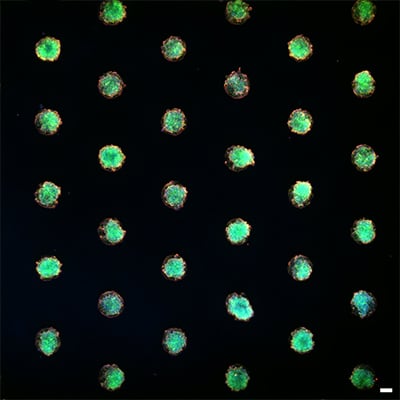
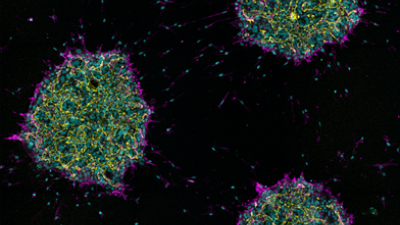
Liver organoids created from adult-derieved stem cells grown on the µ-Slide VI 0.4 with ibiTreat µ-Pattern (cir500, pit1000) coated with collagen I. The cells were overlayed with Collagen Type I gel 24 h after seeding, for another 24 h. Cells were stained with DAPI (magenta) and Phalloidin (green). Imaged with a 10x objective using the EVOS M7000. Image courtesy of Kim Whye Leong, National University of Singapore.
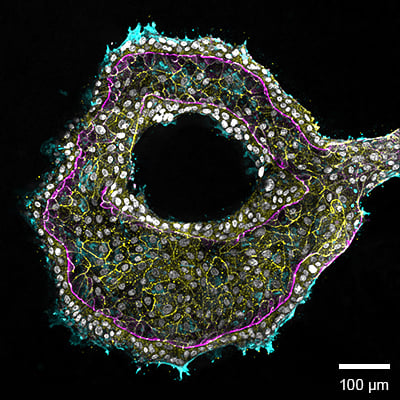
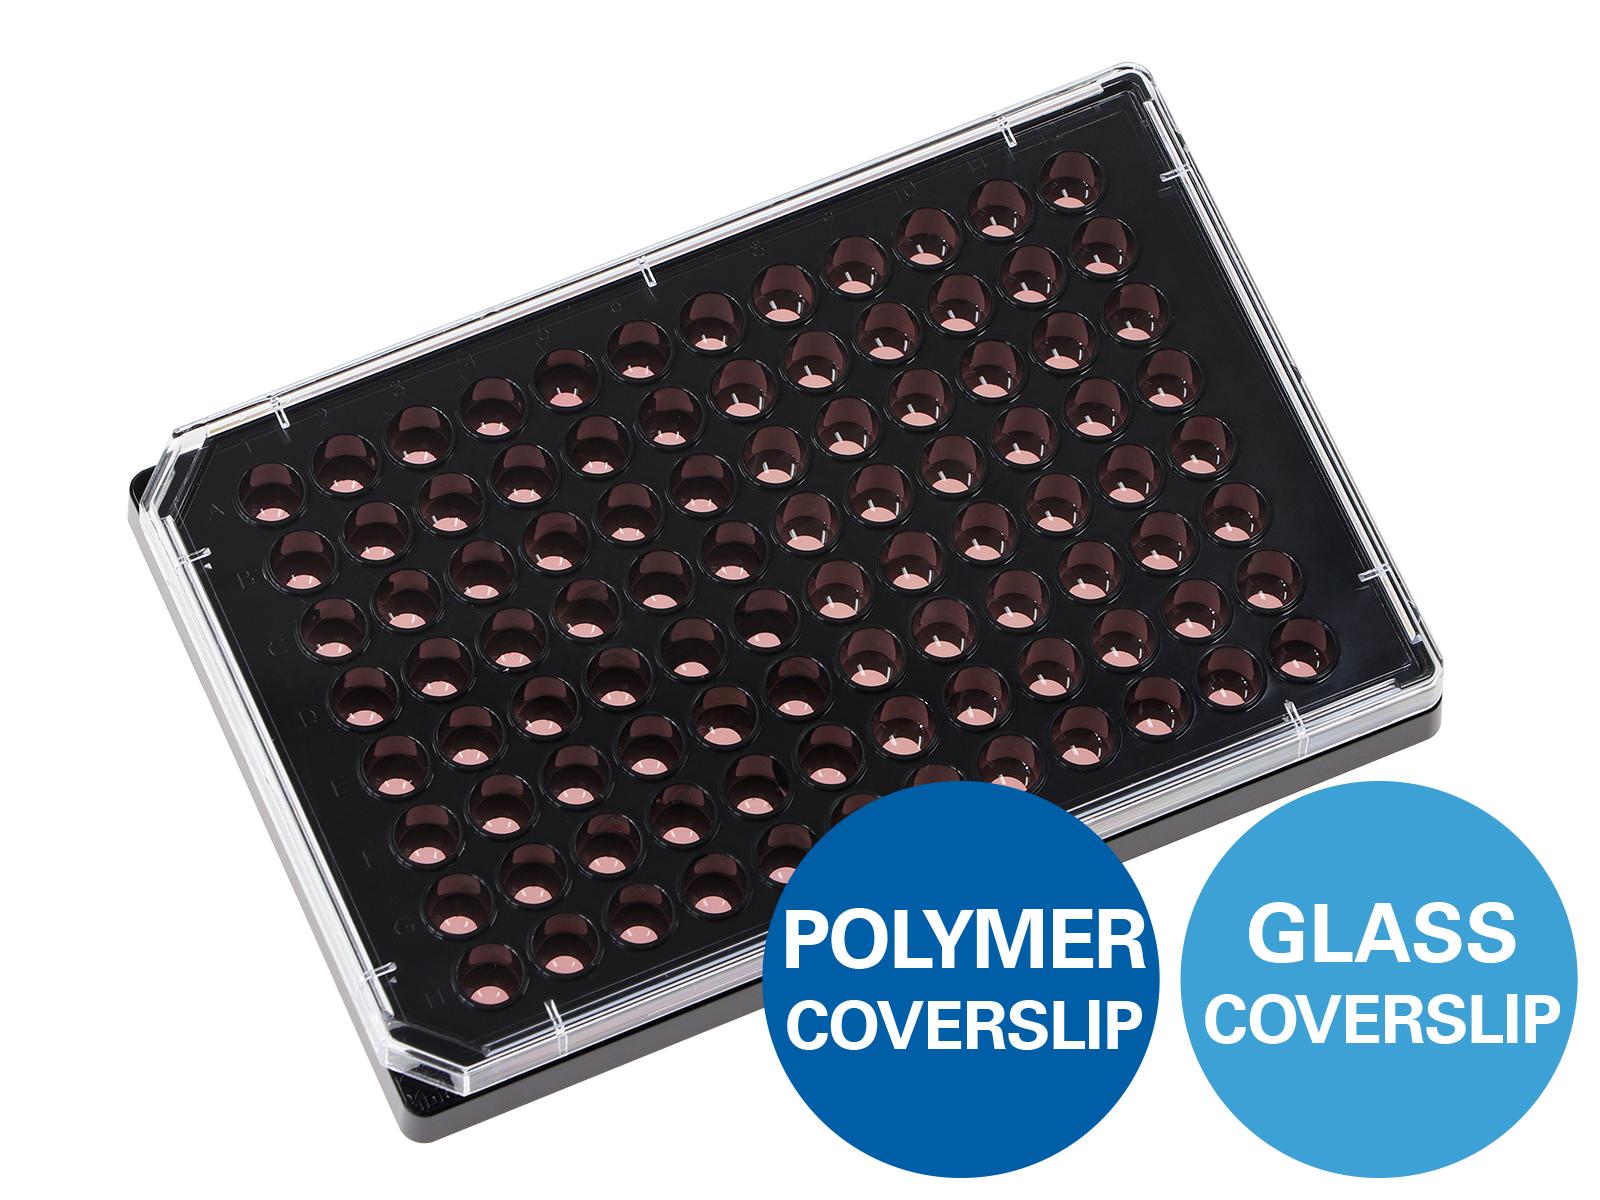
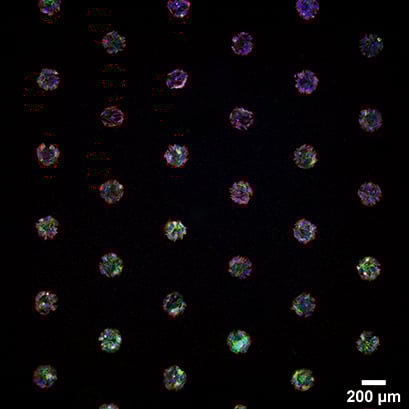
Organoid of adult-derieved stem cells grown on the the ibiTreat µ-Pattern (cir500, pit1000) coated with collagen I in the µ-Slide 8 Well high. The cells were overlayed with collagen I gel 24 h after seeding, for another 24 h. Cells were stained with DAPI (gray) and Phalloidin (magenta), and immunostained with ZO-1 (yellow) and MYH9 (cyan). A z-stack was capured with a 20x objective using the Olympus FV3000 shown as a maximum projected composite fluorescence image. Image courtesy of Kim Whye Leong, National University of Singapore.
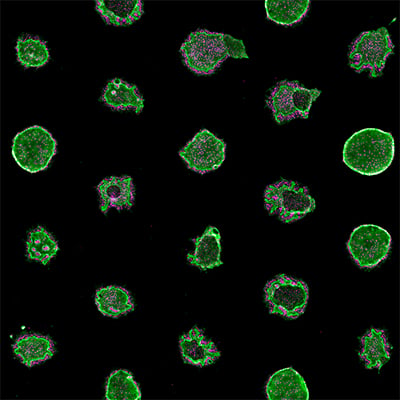
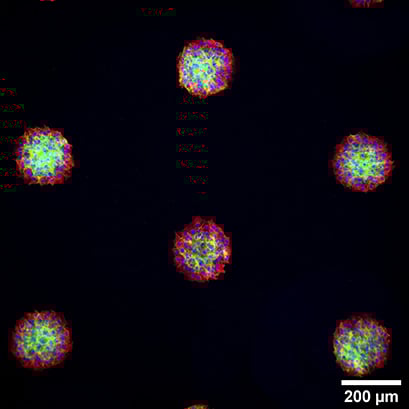
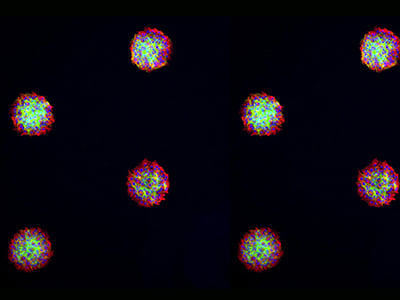
NIH-3T3 spheroids grown in the µ-Slide VI 0.4 µ-Pattern ibiTreat, cir200, pit600, hex, fixed with 4% PFA, and labeled with abberior STAR RED (NUP, red), abberior STAR ORANGE (TOM20, blue), abberior LIVE 510 (actin, green) and DAPI (cell nuclei, grey). Confocal images were conducted with the abberior STEDYCON microscope.
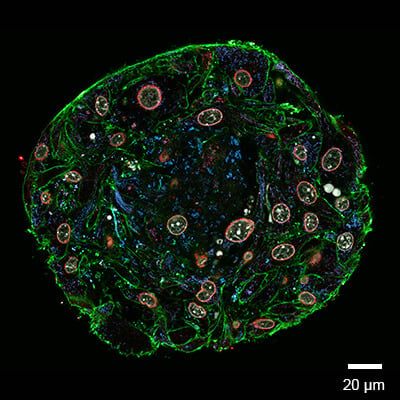
Huh7 hepatocyte cell line derived spheroids - perfused dynamic cultivation in the µ-Slide VI 0.4 ibiTreat cir200, pit600, hex (coated with fibronectin) for 10 days. After fixation, spheroids were stained with DAPI (cell nuclei - blue), phalliodin-488 (actin - green), and an alpha-tubulin mAB (red). Scale bar: 100 µm.
Immunofluorescence staining of spheroids from RCC26 (left) and Rat1 cells (right) in in the µ-Slide VI 0.4 Luer, patterned with 200 µm circles at 600 µm distance. The cells were stained with phalloidin (green) and alpha-tubulin (red). Nuclei were stained with DAPI (blue). Widefield fluorescence microscopy, 4x and 10x objective.
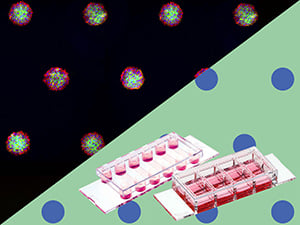
Spheroid Generation
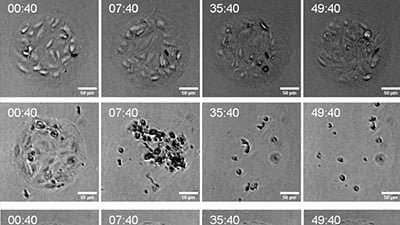
Defined adhesion spots, surrounded by Bioinert, are able to catch all adherent single cells from a cell suspension. Bioinert is fully non-cell-attachable. This forces all cells to aggregate to each other at the adhesion spots, thus forming spheroids in a defined and controllable way.
Suspension of NIH-3T3 cell line seeded on 200 µm adhesion spots, 64 hours live cell imaging, phase contrast, 4x objective lens.

Interested in unlocking new possibilities with ibidi µ-Patterning?
Let's collaborate on a custom solution to meet your research needs! We will work with you to co-develop a tailor-made design here.
You need support or want to test the ibiTreat µ-Patterns first? Contact us at: info@ibidi.com or choose up to three free samples from our ibiTreat micropatterning standard products!
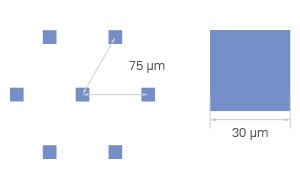
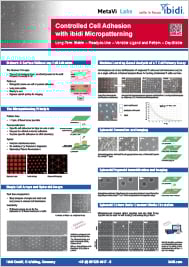
Single-Cell Arrays
The size of the µ-Pattern can be adapted to the morphology of the cell type of interest, so that an array of single cells can be conveniently analyzed using applications such as high-resolution imaging.
Single-cell array with RCC26 tumor cells. Spot size 40 µm x 40 µm. Phase contrast microscopy, 10x objective lens.
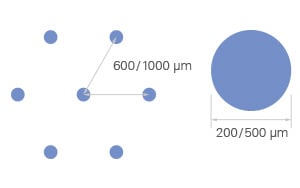
Multi-Cell Monolayer
By using different geometries and sizes of the µ-Patterning, multi-cell arrays can be performed with defined adhesion for various applications, such as high-resolution imaging.
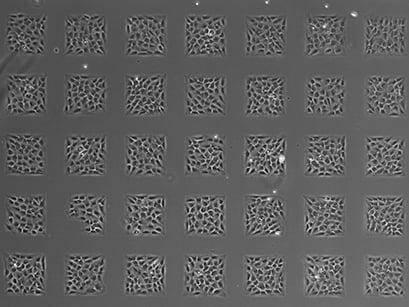
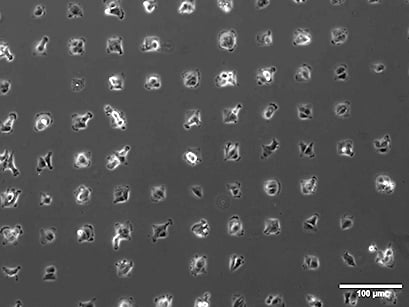
Multi-cell array with Rat1 cells. Spot size 200 µm x 200 µm. Phase contrast microscopy, 4x objective lens.
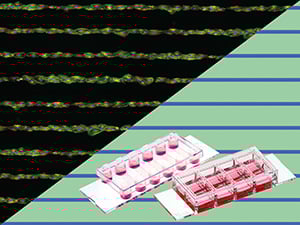
Microlanes
The ready-to-use structured microlane environment supports e.g., neuronal cell and organelle outgrowth, including neurite extension and cell–cell communication. They provide a platform for studying geometry-driven cell migration and polarization, cytoskeletal dynamics, and organelle transport.
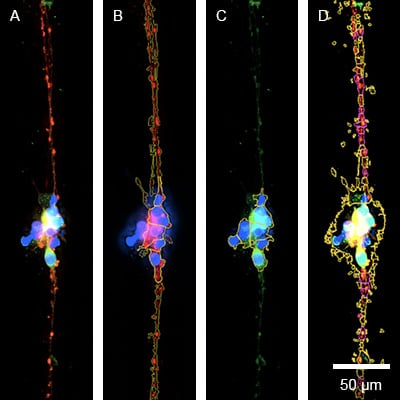
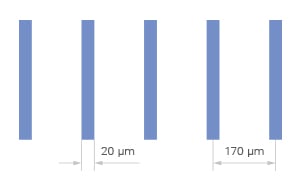
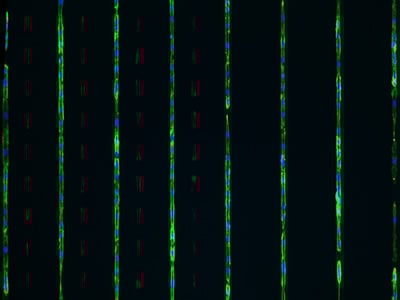
Neuronite outgrowth analysis. Fluorescence overlay image (A) of ß3 tubulin (red), VDAC (Mitochondria) (green/yellow), and the cell nuclei (DAPI). Visual segmentation is indicated by yellow lines to measure the ß3 tubulin staining (B), the VDAC signal in soma (C), and the VDAC signal in axons (indicated in pink) (D). Human iPSC derived sensory neurons were incubated on the μ-Slide VI 0.4 μ-Pattern ibiTreat, lin20, pit170 for 5 days and imaged on a Cytation 7 (Agilent) with a 40x objective lens. Image courtesy of Moran Amit's Lab, University of Texas.
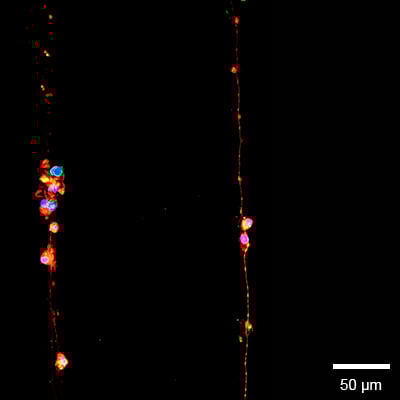
Voltage-dependent anion channel/mitochondrial porins (VDAC) and ß3-tubulin analysis to show the distribution of mitochondria along the cell. Fluorescence overlay image (A) of ß3-tubulin (red), VDAC (mitochondrial porins) (green/yellow) and the cell nuclei (DAPI). Human iPSC derived sensory neurons were incubated on the μ-Slide VI 0.4 μ-Pattern ibiTreat, lin20, pit170 for 5 days and imaged on a Cytation 7 (Agilent) with a 40x objective lens. Image courtesy of Moran Amit's Lab, University of Texas.
Long-Term Spheroid Perfusion: Integrating u-Patterning With the ibidi Pump System
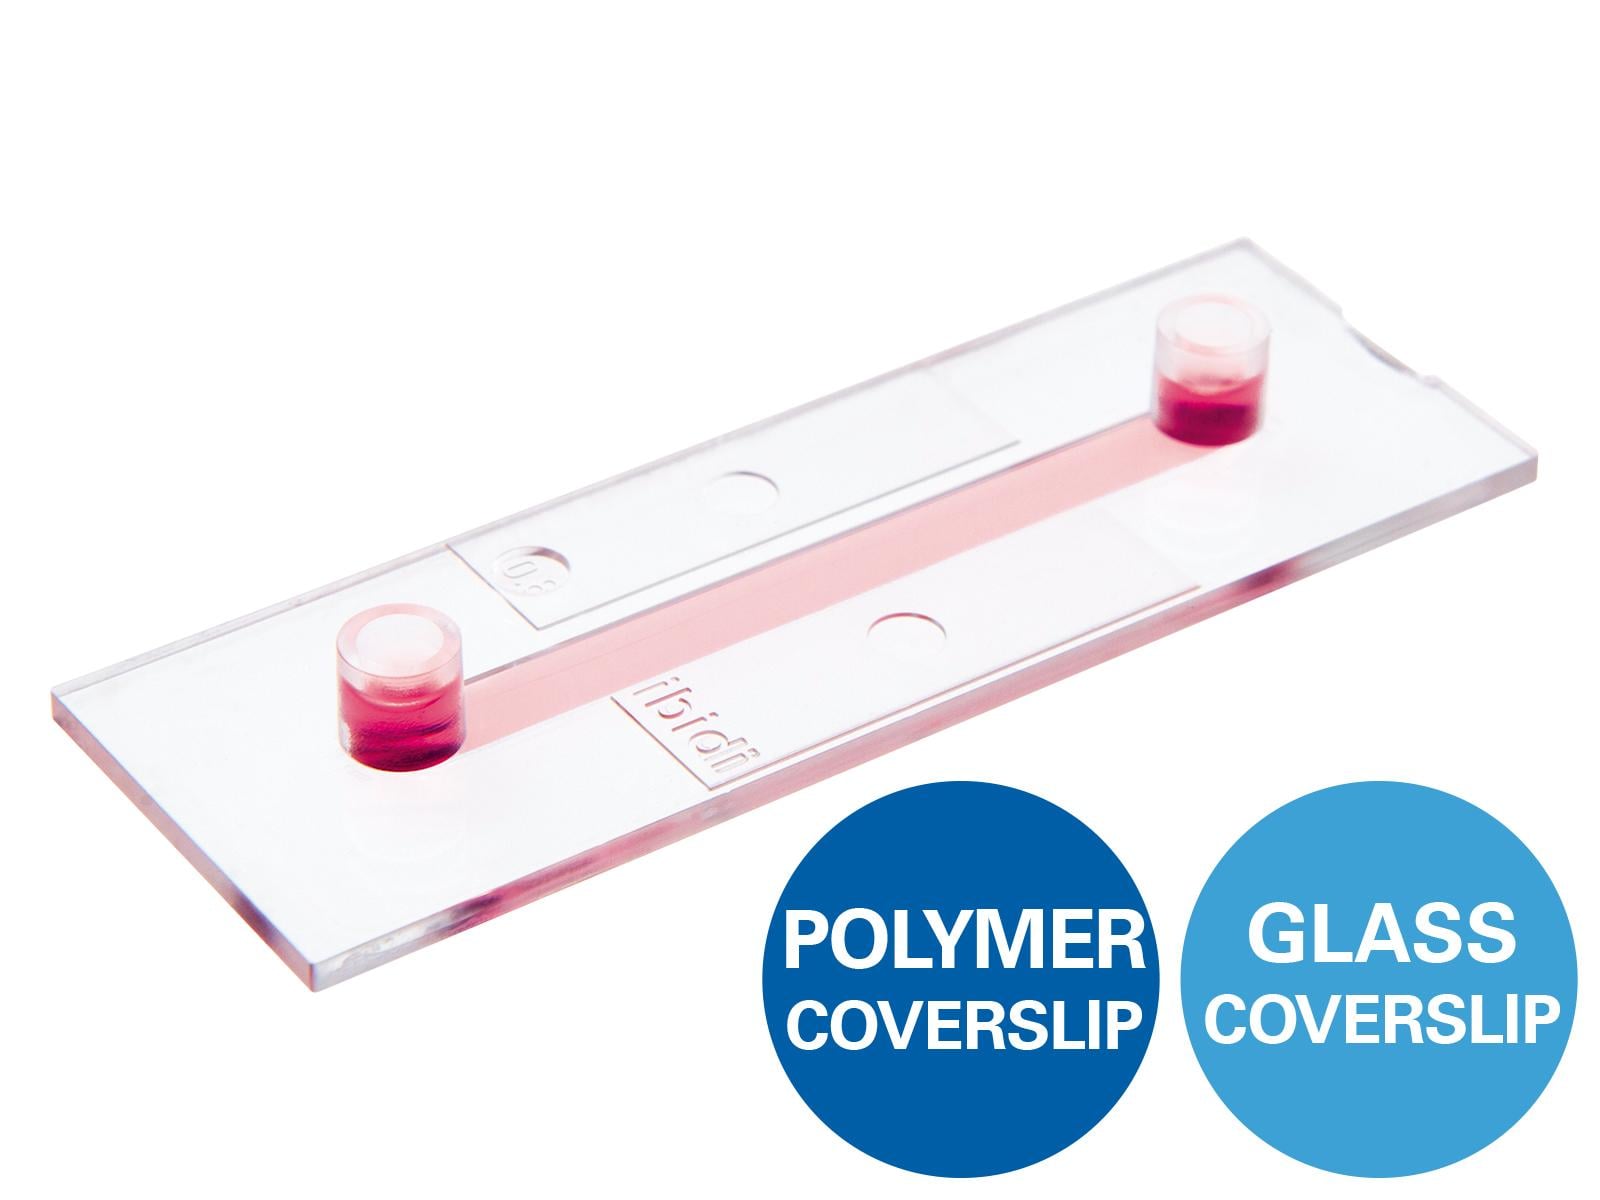
By creating micropatterns within a µ-Slide VI 0.4 Luer, aggregates on the pattern can be constantly supplied with fresh media by perfusing the system with the ibidi Pump System.
By applying a constant media flux around the cell aggregates, spheroids become more compact and round.

3T3 fibroblasts were seeded on a patterned µ-Slide VI 0.4. A shear stress of 3 dyn/cm2 was applied 7 days after cell seeding. 15 h time lapse microscopy, 4x objective.
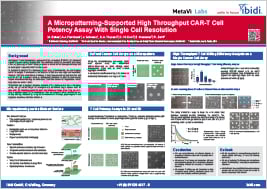
CAR-T Cell Killing Assays
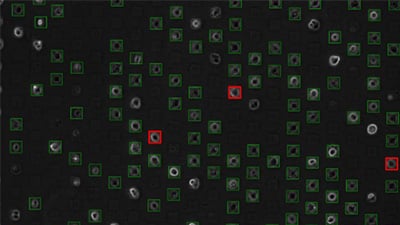
CAR-T cells represent a promising new cancer therapy tool. Live cell imaging allows to analyze T cell/cancer cell interaction in real time with single cell resolution. However, analysis of confluent cell layers is very time-consuming and therefore not possible in high throughput screens. To facilitate high throughput label-free analysis of T cell potency in a live cell imaging setup, we generated arrays of homogenously distributed cancer cells. By combining optical analysis and advanced image processing, cytotoxic T cell activity over time on a single cell level can be evaluated without the use of any labeling.
Single Cells in a 2D Environment
Time lapse microscopy of a CAR-T cell killing assay with RCC-26 tumor cells and JB4 T cells on a single cell pattern (µ-Slide VI 0.4, 20 µm squares, 120 µm distance, rectangular). Data were analyzed using FastTrack AI by MetaVi Labs.
Multi-Cell Spots in a 3D Collagen Matrix
RCC-26 cancer cells immobilized on multi-cell pads (µ-Slide VI 0.4, 200 µm circles, 600 µm distance, hexagonal). Effector T cells applied in a collagen I matrix (Collagen Type I, Rat Tail) induce apoptotic body formation of cancer cells.
Understanding the Key Elements of µ-Patterns
Every ibidi µ-Pattern is designed with precise spatial control, ensuring reproducible cell adhesion and organization. Let's break down the essential pattern components:
- Shape – Defines the geometry of the attachment area (e.g., cir = circle)
- Size – The diameter or width of the attachment area, measured in micrometers (µm) (e.g., 500 µm)
- Pitch – The spacing between adjacent shapes, measured from center to center (e.g., pit1000 = 1000 µm)
- Layout – The overall pattern arrangement, determining how attachment areas are structured (e.g., a hexagonal layout)
- Surface – The cell attachment surface where cells adhere, made of ibiTreat for optimal cell growth


User Protocols
Scientific Posters
Micropatterned Adhesion Sites for Spheroid Cultivation Under Flow (PDF)
Presented at the Annual Meeting of the Biophysical Society 2020, San Diego, USA.
Presented at the ASCB|EMBO Meeting 2019, Washington DC, USA.
Controlled Cell Adhesion With ibidi Micropatterning (PDF)
Presented at the µTAS Conference 2019, Basel, Switzerland.
Frequently Asked Questions
What is micropatterning?
Micropatterning is a technique used to control exactly where cells attach and grow on a surface. By defining adhesive regions with specific shapes and sizes, researchers can control cell position, spreading, and organization in a highly reproducible way. This helps create more standardized experiments and reduces variability in microscopy-based assays. Because the cellular microenvironment strongly influences behavior, precise spatial control can be critical for studying biological processes in a reproducible and quantitative manner.
What are the advantages of micropatterning?
Micropatterning helps you control where cells attach and how they are arranged on the culture surface. Instead of cells growing randomly, they grow in defined positions and shapes, making experiments easier to reproduce and compare. This can simplify microscopy, cell tracking, and quantitative image analysis, especially when cell shape, spacing, or cell–cell contact influences the biological outcome. ibidi provides ready-to-use µ-Patterning labware that can be integrated into standard cell culture workflows without requiring complex patterning equipment or specialized fabrication steps, making micropatterning accessible even for researchers who are new to the technique.
How does micropatterning work?
In general, micropatterning works by creating defined cell-adhesive regions on an otherwise non-adhesive surface. Cells selectively attach only to these predefined areas, resulting in reproducible arrangements such as isolated single cells, clusters, or aligned structures. With ibidi µ-Patterning, this is achieved using the ibiTreat surface as the adhesive region, while the surrounding Bioinert surface prevents unwanted cell attachment. This creates ready-to-use micropatterned culture surfaces where cells attach only where intended.
What are the applications of micropatterning?
Micropatterning is used in many areas of cell biology and bioengineering where spatial control of cells is important. Typical applications include cell migration studies, cytoskeletal organization, mechanobiology, stem cell research, cell polarity studies, controlled cell–cell interactions, differentiation assays, and standardized spheroid generation. It is especially useful for microscopy-based experiments that require reproducible cell positioning.
What is the difference between single-cell, multi-cell, and line arrays?
Single-cell arrays are designed to position individual cells in isolated defined areas, making them ideal for single-cell analysis and morphology studies. Multi-cell arrays allow small groups of cells to attach together, which is useful for controlled cell–cell interaction studies or spheroid generation. Line arrays guide cells into elongated arrangements, making them useful for migration studies, cell alignment experiments, and polarization research.
How can micropatterning support spheroid generation?
Multi-cell arrays can be used to promote controlled cell aggregation and reproducible spheroid formation. By controlling where cells attach and interact, micropatterning helps generate more uniform spheroids compared to spontaneous aggregation methods.
Are ibidi µ-Patterning products suitable for live cell imaging and fluorescence microscopy?
Yes. ibidi µ-Patterning products are designed for microscopy-based workflows and are compatible with live cell imaging, fluorescence microscopy, and immunofluorescence staining. Defined cell positioning simplifies tracking and image analysis, while the ibidi Polymer Coverslip supports high-resolution imaging. For long-term live cell experiments, ibidi Stage Top Incubators help maintain stable environmental conditions directly on the microscope.
How does micropatterning improve experimental reproducibility?
One of the main advantages of micropatterning is improved reproducibility. Because cell position, shape, and spacing are controlled, experiments become more standardized and less dependent on random cell behavior. This is especially helpful in quantitative microscopy and comparative studies where subtle biological differences need to be measured reliably.
Are custom micropatterns possible at ibidi?
Yes. If standard pattern geometries do not match your experimental needs, custom micropatterns can be developed. ibidi offers customized µ-Patterning solutions with tailored shapes, dimensions, and layouts depending on the application. This allows researchers to create experimental designs optimized for specific cell types, workflows, or imaging requirements.