
Chemotaxis Assay Workflow: From Sample Preparation to Data Analysis
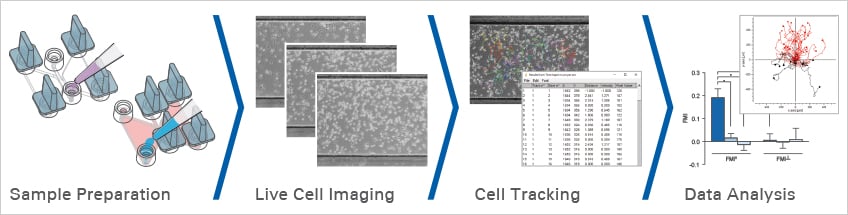
A chemotaxis assay measures directed cell migration along a defined chemical gradient. A reliable chemotaxis assay workflow includes experimental planning, sample preparation, gradient formation, live cell imaging, cell tracking, and quantitative data analysis.
This guide explains how to set up and analyze 2D and 3D chemotaxis assays using time-lapse microscopy. It covers key experimental parameters such as cell type, migration speed, imaging interval, assay duration, controls, and the number of cells required for meaningful single-cell tracking.
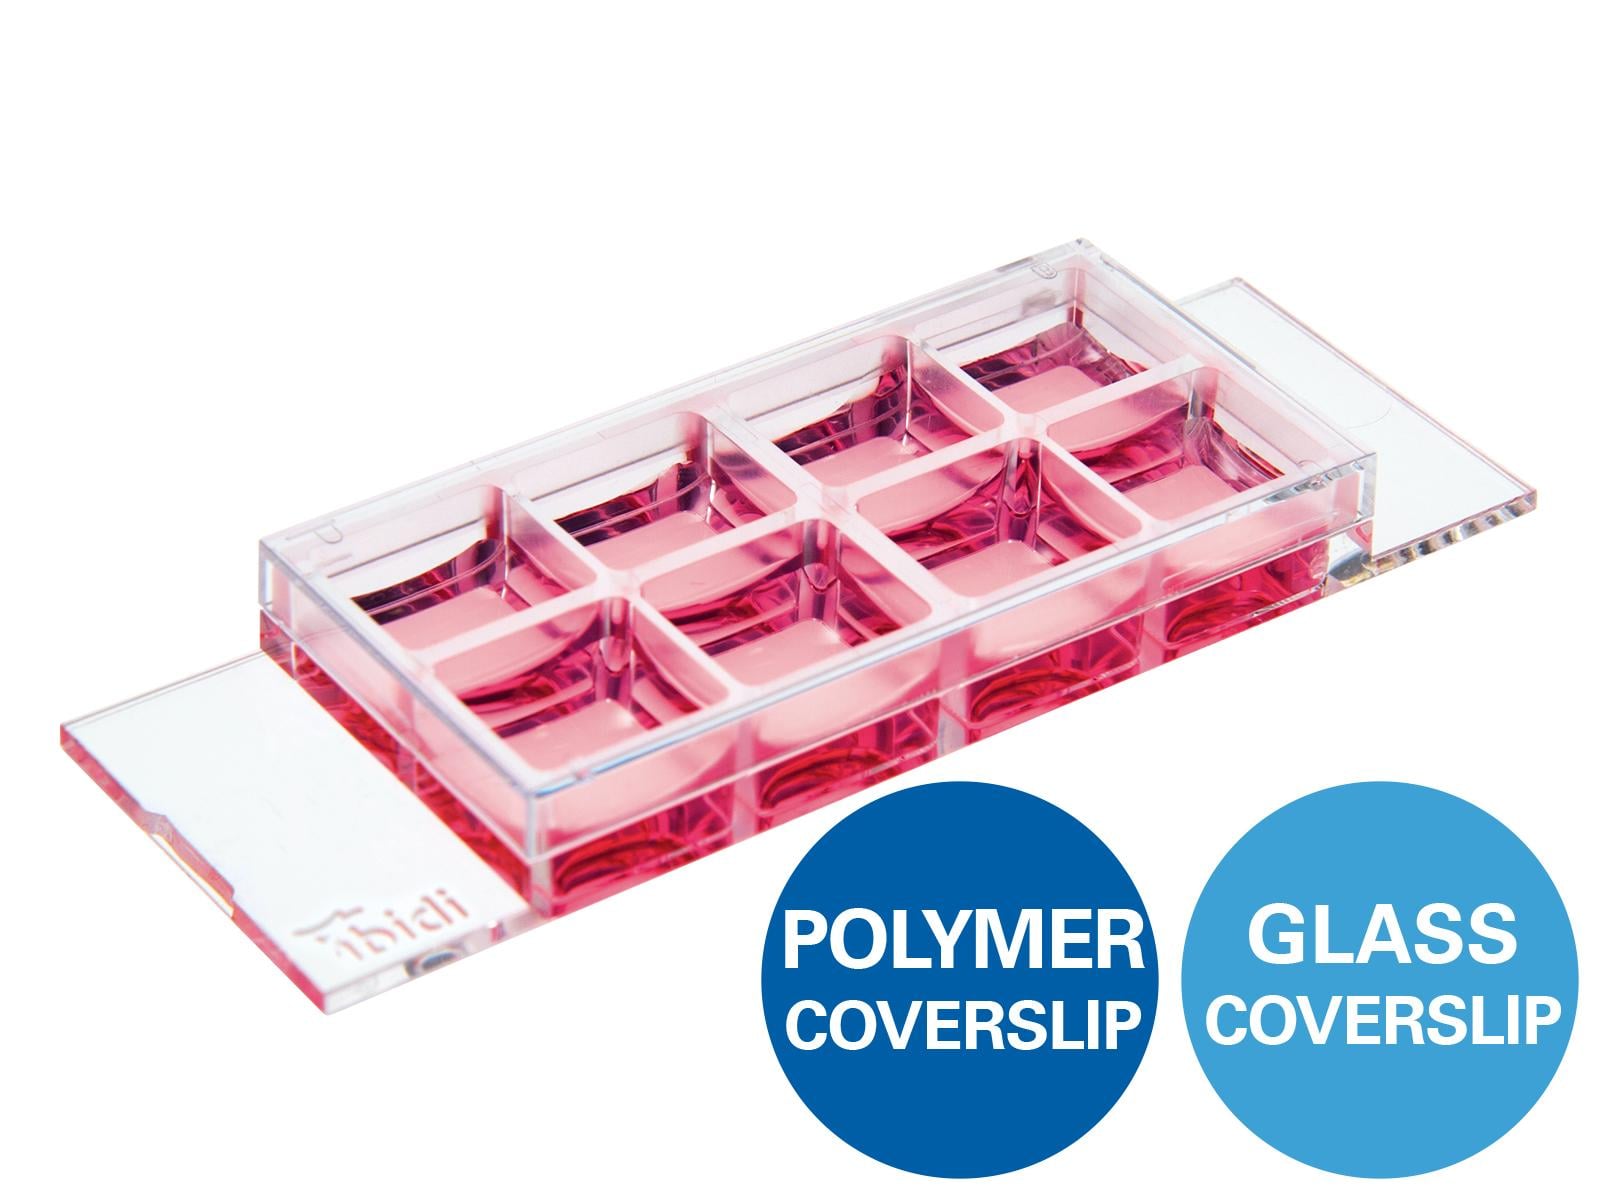
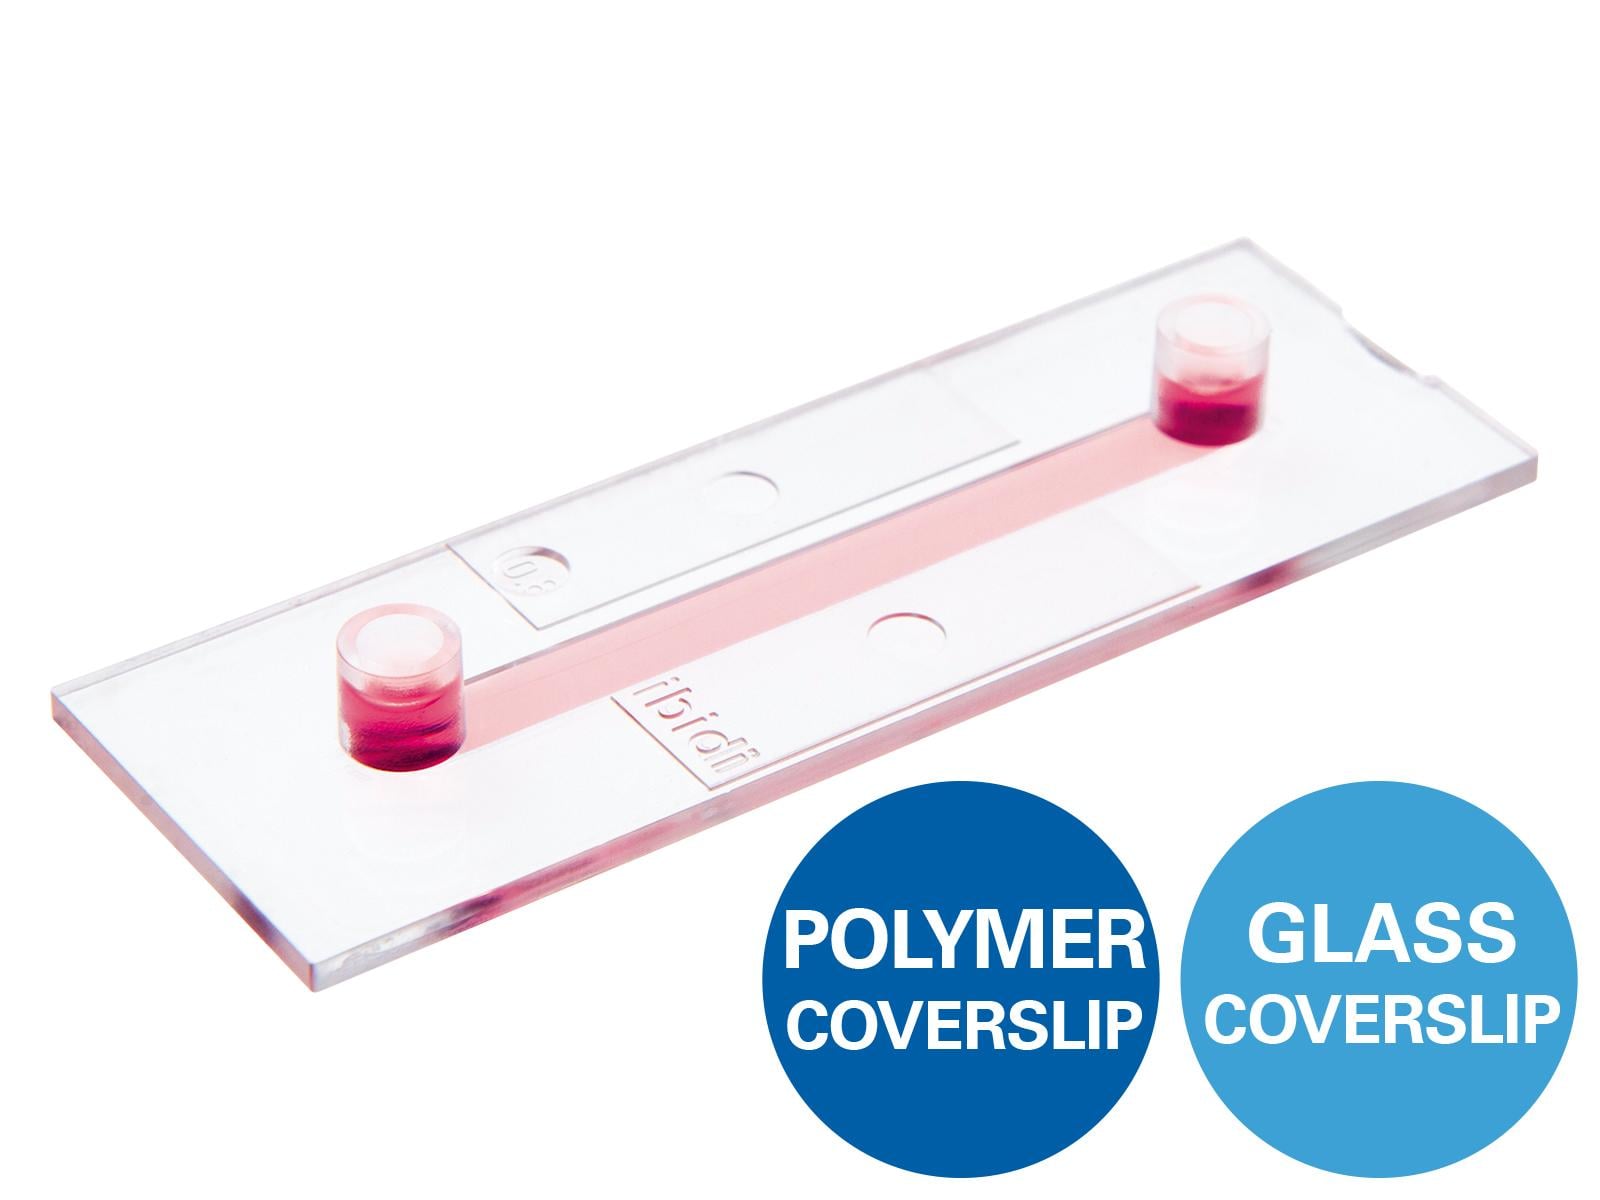
For reproducible chemotaxis experiments, the µ-Slide Chemotaxis for 2D and 3D chemotaxis assays enables stable gradient formation in parallel chambers and supports both slow- and fast-migrating cell types.
A chemotaxis assay workflow typically includes sample preparation, chemoattractant gradient formation, live cell imaging, cell tracking, and quantitative migration analysis. For reliable results, the experiment should include a negative control without chemoattractant, a positive control with uniform chemoattractant exposure, and an experimental gradient condition.
Chemotaxis Assay Workflow at a Glance
Step 1: Plan the Experiment
Select the cell type, medium, chemoattractant, assay format, controls, imaging interval, experiment duration, and number of biological repeats.
Step 2: Prepare the Sample
Seed cells in a 2D environment or embed them in a 3D matrix, depending on the biological question and cell type.
Step 3: Establish the Chemotactic Gradient
Load the reservoirs with chemoattractant and control medium according to the experimental design to create a defined chemical gradient.
Step 4: Perform Live Cell Imaging
Acquire time-lapse images under controlled temperature, humidity, and gas conditions to document cell migration over time.
Step 5: Track Cells and Analyze Migration Data
Track individual cells and analyze directionality, velocity, accumulated distance, Euclidean distance, Forward Migration Index, and chemotactic response.
Before Starting a Chemotaxis Assay
Before starting, define the cell type, migration speed, assay format, chemoattractant concentration, medium composition, imaging interval, experiment duration, number of biological repeats, and required controls.
Required Equipment
Basic requirements
- Inverted phase contrast microscope (5x or 10x objective recommended)
- Camera for time lapse image acquisition
- stage top incubation for long-term live cell imaging (required for most mammalian cell types)
Recommended Imaging Setup
- Motorized stage for parallel image acquisition
- Autofocus
- Environmental control for temperature, humidity, CO2, and, if required, O2
Key Experimental Questions
For a successful chemotaxis experiment, please address the key experimental questions before starting.
Sample Preparation for 2D and 3D Chemotaxis Assays
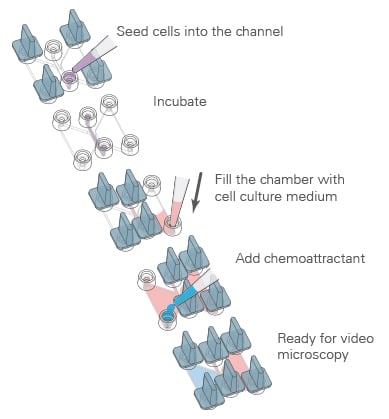

Procedure
Using the µ-Slide Chemotaxis for 2D and 3D chemotaxis assays, reproducible chemotaxis assays with defined chemotactic gradients can be carried out.
First, the cells are seeded, which can be done either in a 2D or a 3D environment. After incubation and cell attachment, the two reservoirs of each chamber are filled with the chemoattractant, according to the determined loading scheme.
More information about the detailed handling of the µ-Slide Chemotaxis can be found in the Application Note AN 17: Chemotaxis 2D and 3D (PDF).
Explore the µ-Slide Chemotaxis for reproducible 2D and 3D chemotaxis assays.
ibidi Solution
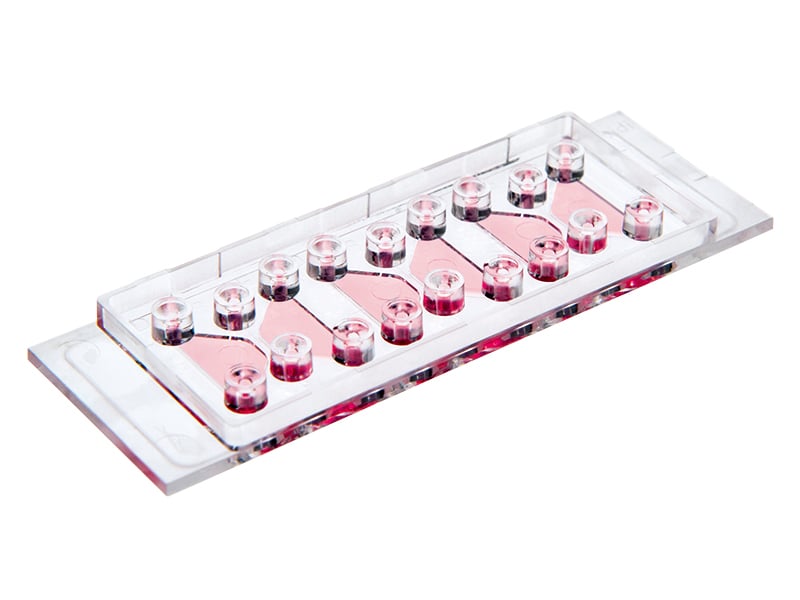
The µ-Slide Chemotaxis contains 3 separate chambers for parallel chemotaxis assays using slow or fast migrating cells.
It allows for the creation of a precisely defined, stable chemotactic gradient in a reproducible environment.
Live Cell Imaging During Chemotaxis Assays
Time-lapse microscopy of the migration of MDA-MB-231 human breast adenocarcinoma cells in a collagen gel. Cells were observed over a period of 24 hours in the µ-Slide Chemotaxis with EGF as chemotactic agent. Physiologic conditions were maintained by the ibidi Heating and Gas Incubation System.
Procedure
Live cell imaging under physiological conditions enables the detailed documentation of cell migration over time, a process which is necessary for the proper analysis of a chemotaxis assay.
The duration of the imaging period depends on the cell type (e.g., fast migrating leukocytes or slow migrating tumor cells or fibroblasts) and the environmental conditions (e.g., type and concentration of the chemotactic agent). A typical video microscopy setup for slow migrating cells includes taking a photo every 2.5–10 minutes over a period of 24 hours.
Since each experiment optimally contains tracking data from 20–40 single cells, low-magnification microscopy objective lenses, such as 4x or 10x, should be used.
Maintain stable physiological conditions during long-term chemotaxis imaging with ibidi Stage Top Incubators.
ibidi Solution
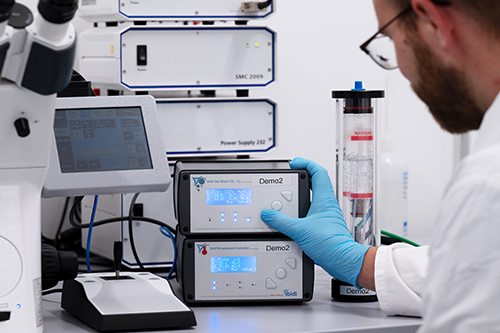
The ibidi Stage Top Incubators provide a physiological environment under the microscope, which enables live cell imaging during short-term and long-term chemotaxis assays.
Cell Tracking and Quantification
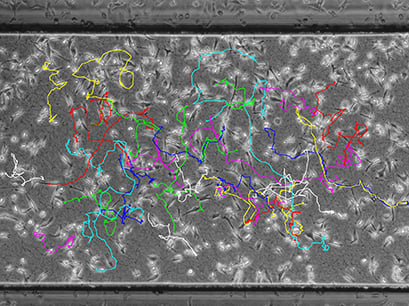
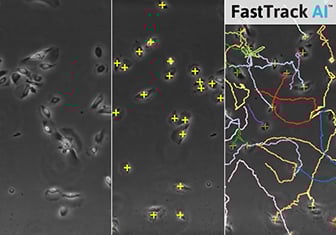
Visualization of cell traces after tracking with the ImageJ Manual Tracking plugin.
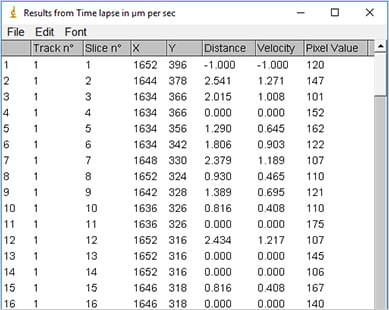
Output of the ImageJ Manual Tracking Plugin after tracking; data table with positional values of each tracked cell (x, y) for each time point (t).
Procedure
Typically, live cell microscopy of a chemotaxis assay creates a temporal image stack, where each image displays the exact cell position at a specific time point.
For quantification of their movement, single cells are tracked over time by determining their position on each frame of the image stack. The tracking can be done either manually or automatically using special software. Afterwards, the positional values of each tracked cell (x, y) are available for each time point (t) and can be further analyzed.
The ibidi Science HubDiscover our application chapters and free online courses. |
|
Manual TrackingThe ImageJ Manual Tracking Plugin assists in manually tracking cell migration in chemotaxis assays. It can be downloaded for free here. |
|
Chemotaxis Data Analysis
![]()
Find a detailed description of the data analysis steps of chemotaxis assays here:
Analyze cell trajectories, migration directionality, and chemotaxis parameters with the ibidi chemotaxis data analysis and interpretation workflow and the chemotaxis and migration analysis tool.
Key Experimental Questions Before Starting an Experiment
In order to set up a chemotaxis assay correctly, it is crucial to answer the following questions first:
Which cell type are you planning to investigate?
Knowing your cell type of interest—including the culture medium requirements and the migration speed—is essential for subsequent assay planning.
What is the migration speed / velocity of the cell type being analyzed?
Whereas some cells have a low migration speed (e.g., tumor cells or fibroblasts), other cell types (e.g., leukocytes) migrate very quickly. The cell migration speed will determine the duration of the experiment and the intervals required between the images. Also, the gradient stability must be high enough to fit the total duration of the experiment. The µ-Slide Chemotaxis is suitable for chemotaxis assays with both slow and fast migrating cells.
| Slow migrating cells | Fast migrating cells | |
| Migration type | Mesenchymal | Amoeboid |
| Examples | Endothelial cells, cancer cells, fibroblasts, stem cells | T cells, neutrophils, dendritic cells, Dictyostelium discoideum |
| Speed | One cell length per hour: ∼10 µm/h | One cell length per minute: ∼10 µm/min |
| Frame rate (time lapse) | 1 image per 10 min | 1 image per 30 s |
| Typical experiment duration | 12–24 h | 15–30 min |
What is the optimal culture medium?
Most cell types are cultured in a medium supplied with fetal calf serum (FCS). FCS contains many factors (e.g., enzymes, hormones and growth factors) that can influence the cell migration, and therefore might alter the outcome of a chemotaxis assay. For example, the effects of a chemotactic agent on cell migration can be masked by FCS-induced effects. Gradual reduction of the FCS concentration in the medium, before starting the assay, is one way to overcome this issue. Furthermore, special, serum-free culture media without FCS have been developed. The optimal medium composition for each cell type of interest must be tested before starting the assay.
What is the optimal seeding density for the cell type of interest?
The seeding density depends on many cellular factors, such as the proliferation rate, behavior, shape, epithelial or mesenchymal state, and the dependence on cell-cell contacts. In addition, the experiment duration must be considered when determining the optimal cell seeding density. In order to have enough trackable cells, the density must not be too low when starting the experiment. At the endpoint of the experiment, single cells should be clearly definable and trackable. Considering these factors, the optimal seeding density should be separately determined for each cell type before starting the chemotaxis assay.
How many experiments should be performed?
Typically, three to five repeat experiments are sufficient to create significant data from the chemotaxis group and the respective control group. Each experiment should contain tracking data from 20–40 single cells, which is possible using low-magnification microscopy objective lenses, such as 5x or 10x.
Controls and Experimental Design
Which controls must be included in the experiment?
For the correct analysis of a chemotaxis experiment, it is crucial to include a negative control without any chemoattractant (-/-), as well as a positive control with chemoattractant over the entire chamber (+/+).
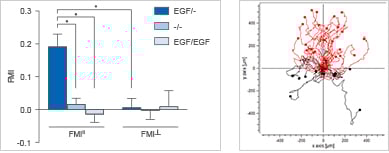
Using the µ-Slide Chemotaxis, a minimum of control measurements are required, since all conditions other than the gradient are symmetric. This allows for the analysis of chemotaxis and chemokinesis independently of each other. In the example, the chemoattractant induces both the chemotaxis and chemokinesis of cancer cells.
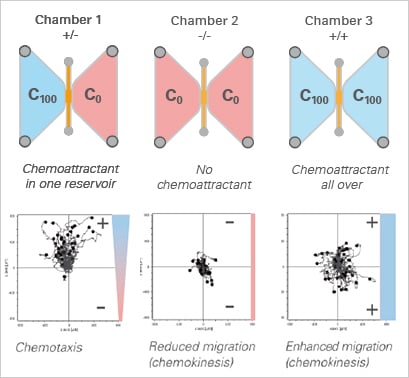
Experimental setup (top) and data plots (bottom) of a chemotaxis assay including the experimental group (+/-), a positive (+/+), and a negative (-/-) control group.
2D vs 3D Chemotaxis Assays
Should I perform a 2D or a 3D chemotaxis assay?
Most cells are naturally embedded in a 3D matrix. Culturing them in a 2D environment during a chemotaxis assay might alter their behavior and migrational capabilities. To overcome this issue, cells can be embedded in a 3D matrix that mimics their natural environment, such as collagen, Matrigel, or other hydrogels. The µ-Slide Chemotaxis is ideally suitable for both 2D and 3D experiments.
Advantages of 3D Chemotaxis Assays
- More in vivo-like setting for most cell types
- Highly defined environment, for example fibers or matrix
- Chemotaxis assays with suspension cells possible
Limitations of 3D Chemotaxis Assays
- Difficult gel handling; more parameters to control during the experiment
- Cells might attach to 2D surface, thus creating 2.5D conditions
- Cells might go out of focus during 3D tracking
Find more information about 2D and 3D chemotaxis assays in the following Application Notes:
ibidi Solutions for Chemotaxis Assays
The µ-Slide Chemotaxis for 2D and 3D chemotaxis assays enables stable gradient formation in a reproducible assay format. For long-term microscopy, stage top incubation for long-term live cell imaging helps maintain physiological conditions directly on the microscope. For 3D assays, Collagen I for 3D chemotaxis assays can be used as a gel matrix. For downstream evaluation, the chemotaxis and migration analysis tool supports quantitative analysis of cell trajectories and migration parameters.
Read on and learn more about Chemotaxis in Cell Physiology, the overview of chemotaxis assay methods, or chemotaxis data analysis and interpretation.
Frequently Asked Questions on Chemotaxis Assay Workflows
What is a chemotaxis assay workflow?
A chemotaxis assay workflow describes the experimental steps used to measure directed cell migration along a chemical gradient, including sample preparation, gradient setup, live cell imaging, cell tracking, and data analysis.
Which controls are needed for a chemotaxis assay?
A chemotaxis assay should include a negative control without chemoattractant, a positive control with chemoattractant throughout the chamber, and the experimental gradient condition. These controls help distinguish directed chemotaxis from random migration, chemokinesis, or non-specific environmental effects.
How many cells should be tracked in a chemotaxis assay?
Each experiment should typically contain tracking data from 20–40 single cells. This is usually possible with low-magnification objective lenses, such as 5x or 10x, which allow enough cells to be observed within the field of view.
How long should a chemotaxis assay be imaged?
The imaging duration depends on the migration speed of the cell type. Slow migrating cells, such as tumor cells or fibroblasts, are often imaged for 12–24 hours with longer intervals between images. Fast migrating cells, such as leukocytes, may require shorter experiments of 15–30 minutes with higher frame rates.
Should I use a 2D or 3D chemotaxis assay?
The choice depends on the biological question and the cell type. A 2D chemotaxis assay is easier to handle and image, while a 3D chemotaxis assay provides a more in vivo-like environment for cells that naturally migrate within extracellular matrices such as collagen or other hydrogels.