
Chemotaxis Data Analysis: Parameters, Interpretation, and Example Chemotaxis Results
How to Analyze Chemotaxis Data
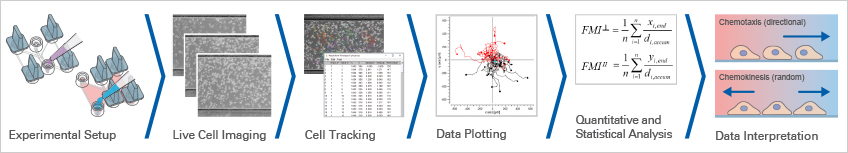
Chemotaxis data analysis determines whether cell migration is directed, random, or influenced by non-chemotactic factors. This chapter explains how chemotaxis assay analysis is performed, from live cell imaging data and cell tracking to trajectory plots, quantitative chemotaxis analysis, and chemotaxis data interpretation. Using a practical example chemotaxis experiment, it shows how key metrics such as the Forward Migration Index (FMI), Rayleigh test, Center of Mass, and Directness are used to evaluate cell migration directionality and confirm significant migration towards a chemoattractant.
Chemotaxis assay analysis combines trajectory plots, quantitative chemotaxis analysis, and statistical testing to distinguish directed migration from random cell movement. Important readouts include the Forward Migration Index, Rayleigh test, Center of Mass, and Directness, which together support reliable chemotaxis data interpretation and analysis of cell migration directionality.
Example Chemotaxis Assay Data and Analysis
This example chemotaxis experiment shows how chemotaxis data can be analyzed and interpreted in a 3D chemotaxis assay. It includes all relevant files for reviewing and practicing each step of chemotaxis data analysis and interpretation. The assay was performed using the µ-Slide Chemotaxis with the MDA-MB-231 human breast adenocarcinoma cell line. Epidermal growth factor (EGF) was applied as a defined chemotactic attractant to induce directed cell migration.
In addition to the experimental group (EGF/-), both a negative (-/-) and a positive (EGF/EGF) control group were included to validate the chemotactic effect. The assay was performed using three biological repeats of each experimental group, enabling robust statistical analysis of chemotaxis parameters and comparison of chemotaxis assay results.
Experimental Setup of the Chemotaxis Assay
| Parameter | Value |
| Cells | MDA-MB-231 (human breast adenocarcinoma cells) |
| Slide | µ-Slide Chemotaxis, ibiTreat (80326) |
| 3D gel matrix | Collagen Type I, 1.5 mg/ml |
| Experimental medium | UltraCULTURETM Serum-Free Medium (Lonza) |
| Attractant medium [EGF] | 10 ng/ml EGF in UltraCULTURETM Serum-Free Medium (Lonza) |
| Chamber 1 | Experimental group (EGF/-) |
| Chamber 2 | Negative control group (-/-) |
| Chamber 3 | Positive control group (EGF/EGF) |
| Imaging mode | Phase contrast |
| Imaging period | 24 h |
| Time interval | 10 min |
| X/Y calibration (pixel size) | 0.805 µm/px |
| Number of slices/images | 145 |
| Sample size | 40 counted cell tracks per chamber, three biological repeats (one example for download) |
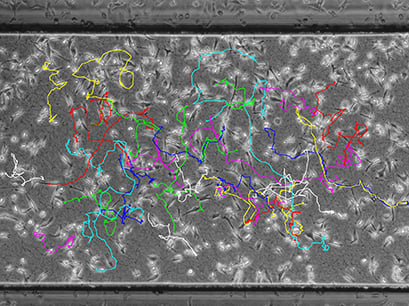
After live cell imaging, the following image stacks were obtained as raw data for subsequent cell tracking. Each stack contains 145 images acquired over 24 hours at 10 minute intervals.
Download the image stacks of the example experiment here:
| EGF/- (experimental group) | -/- (negative control group) | EGF/EGF (positive control group) |
| eg_live_cell_imaging_ picture_stacks.zip | nc_live_cell_imaging_ picture_stacks.zip | pc_live_cell_imaging_ picture_stacks.zip |
The following values were obtained by manual tracking using the ImageJ Manual Tracking Plugin (tab-delimited text). The files can be directly imported into the Chemotaxis and Migration Tool for further analysis.
Download the manual tracking results of the example experiment here:
| EGF/- (experimental group) | -/- (negative control group) | EGF/EGF (positive control group) |
| eg_manual_tracking_ results.txt | nc_manual_tracking_ results.txt | pc_manual_tracking_ results.txt |
Chemotaxis Data Plotting and First Data Interpretation
After tracking, the paths of the cells can be visualized in trajectory plots that already provide information about chemotactic effects. This is usually done using special software.
In a trajectory plot, all (x,y) coordinates of the cells' starting points are set to (0,0) using a coordinate transformation. With this setting, the general direction of cell migration is displayed and enables a first chemotaxis data interpretation. To finally confirm whether observed migration is directed or random, the data must be statistically analyzed.
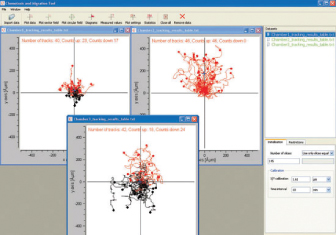
Data plotting using the Chemotaxis and Migration Tool allows for a first visual inspection of the cell trajectories, including the cell velocity and directionality:
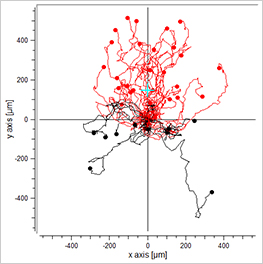
EGF/-
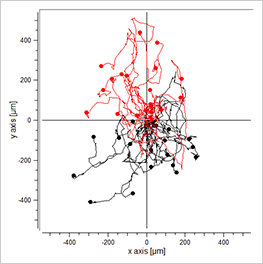
-/-
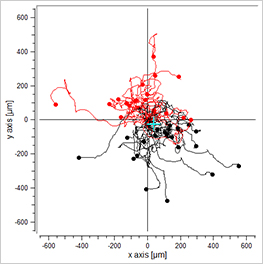
EGF/EGF
Visualization of the cell migration in a chemotaxis assay, showing the experimental group (EGF/-), the negative (-/-), and the positive (EGF/EGF) control group. Red cell trajectories show the migration towards the chemotactic agent, black cell trajectories indicate the migration in the opposite direction.
The EGF/- group shows cell migration in the direction of the gradient. In contrast, the -/- and the EGF/EGF group show cell migration without any clear direction. In this experiment, the trajectory plots already indicate a chemotactic effect of the EGF. However, in order to confirm chemotactic, directed cell migration towards EGF and to exclude any environmental factors, a thorough statistical analysis of the chemotaxis parameters is mandatory.
ibidi Solution
The Chemotaxis and Migration Tool allows for the fast and easy creation of cell trajectory plots, as well as subsequent statistical analysis. For a better visualization of the chemotaxis effects, additional information can be displayed in the plots (e.g., color information of cells moving up/down, center of mass, and cell endpoints). All data can be exported for further analysis. The tool is freely available: Download the Chemotaxis and Migration Tool.
To analyze chemotaxis assays correctly, it is essential to understand the key chemotaxis parameters and how they are calculated.
The parameters for chemotaxis data analysis include the Forward Migration Index (FMI), the Center of Mass, the Rayleigh test, and Directness. Together, these values help determine whether observed cell migration is directed or random. The most important parameter for quantifying chemotactic cell migration is the Forward Migration Index (FMI┴, FMIII). A further measure of directed cell migration is the Center of Mass (Mend). Additionally, we recommend the Rayleigh test, which statistically determines if the cell distribution is homogeneous or inhomogeneous.
Further migration parameters are the Directness (D) and cell velocity, which, however, may not necessarily indicate a chemotaxis effect. All these relevant chemotaxis values can be automatically calculated by using the Chemotaxis and Migration Tool.
Zengel P, et al. (2011) µ-Slide Chemotaxis: a new chamber for long-term chemotaxis studies. BMC Cell Biol 10.1186/1471-2121-12-21.
Read article
Chemotaxis plot displaying FMI, Center of Mass, Directness, and Rayleigh test parameters.
Example Chemotaxis Data Analysis
Statistical analysis of the example experiment using the Chemotaxis and Migration Tool generated the following values, which include all important chemotaxis parameters. These results show how the key chemotaxis parameters differ between the experimental group and the positive and negative control groups.
| Parameter | EGF/- (experimental group) | -/- (negative control group) | EGF/EGF (positive control group) |
| Forward migration index, perpendicular, FMI┴ [xFMI] | 0.014 | -0.014 | 0.056 |
| Forward migration index, parallel, FMIII [yFMI] | 0.18 | -0.00021 | -0.025 |
| Directness [D] | 0.32 | 0.32 | 0.33 |
| Center of mass x [xend, µm] | 1.39 | -15.78 | 38.56 |
| Center of mass y [yend, µm] | 146.19 | 1.83 | -25.38 |
| Center of mass length [Mend µm] | 146.2 | 15.88 | 46.16 |
| Rayleigh test (p-value) | 0.0012 | 0.79 | 0.34 |
| Mean accumulated distance [daccum, µm] | 799.89 | 665.8 | 730.94 |
| Mean Euclidean distance [deuclid, µm] | 260.08 | 211.27 | 235.39 |
| Cell velocity [µm/min] | 0.56 | 0.46 | 0.51 |
These chemotaxis parameters are used to determine whether a chemoattractant induces directed cell migration.
Download the measured values of the example experiment here:
| EGF/- (experimental group) | -/- (negative control group) | EGF/EGF (positive control group) |
| eg_measured_values.txt | nc_measured_values.txt | pc_measured_values.txt |
The following criteria must be fulfilled to determine directed, chemotactic cell migration and to exclude biased migration by non-chemotactic environmental factors:
- The FMIII of the experimental group (+/-) must be significantly higher than the FMIII of the respective positive (+/+) and negative (-/-) control groups
- The FMIII of the experimental group must be significantly higher than the corresponding FMI┴, which must be close to zero
- The FMI┴ and the FMIII of the control groups (+/+, -/-) must be close to zero
- The Rayleigh test of the experimental group must result in p < 0.05 (significant)
- The Rayleigh test of the control groups must result in p > 0.05 (not significant)
If these criteria are not fulfilled, the cell migration must be considered as random and non-directed.
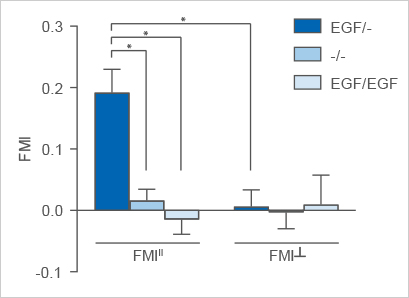
Averaged FMIII and FMI┴ of the EGF/- experimental group in comparison to the -/- and the EGF/EGF control groups. Significant chemotaxis is observable parallel to the gradient in the EGF/- group. Please note: this graph includes three biological replicates.
In this experiment, the FMIII of the EGF/- group is significantly higher than the FMIII of the -/- and EGF/EGF control groups. Further, the FMIII of the EGF/- group is significantly higher than the corresponding FMI┴, which is close to zero. The FMI┴ and the FMIII of both control groups are close to zero as well. The Rayleigh test results in p < 0.05 in the EGF/- group and p > 0.05 in the control groups.
Taken together, these results demonstrate significant chemotactic migration of MDA-MB-231 cells towards EGF.
Key Parameters for Chemotaxis Data Analysis
The most important parameters for chemotaxis data analysis are the Forward Migration Index (FMI), the Rayleigh test, the Center of Mass, and Directness. Together, these metrics support quantitative chemotaxis analysis and help determine whether cell migration is directional, statistically significant, and specifically guided by a chemoattractant.
Forward Migration Index (FMI┴, FMIII)
The Forward Migration Index (FMI) is an important measure for directed, chemotactic cell migration. It represents the efficiency of the forward migration of cells. For FMI calculation, it is necessary to define the direction of the x-axis and the y-axis in relation to the chemotactic gradient. Here, we define the x-axis as perpendicular to the gradient (┴) and the y-axis as parallel to the gradient (║).
To determine if directed cell migration occurs in a chemotaxis assay, two FMI values have to be calculated:
- FMI┴ (xFMI) describes the forward migration of cells in a direction perpendicular to the gradient
- FMIII (yFMI) describes the forward migration of cells in a direction parallel to the gradient
Higher FMI values indicate stronger directional migration along the respective axis.
Rayleigh Test
The Rayleigh test is a statistical test for the uniformity of a circular distribution of points (cell endpoints). With p < 0.05, the null hypothesis (uniformity) is rejected, indicating a chemotaxis effect. Like all statistical tests, this one strongly depends on the number of analyzed cells. The Rayleigh test for vector data also includes the distance from the origin.
Moore BR., 1980, A modification of the Rayleigh test for vector data, Biometrika, Volume 67, 175-180
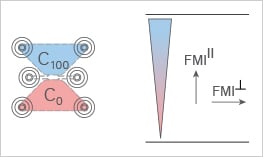
Illustration of the Forward Migration Index parallel (FMIII) and perpendicular (FMI┴) to the chemotactic gradient. C0 and C100 indicate the initial and final cell areas, respectively.
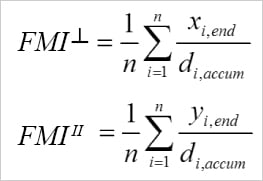
Calculation of the FMI┴ and the FMIII. i = index of single cells, n = number of cells, xi,end, yi,end = coordinates of the cells' endpoints, di,accum = accumulated distance of the cells' paths.
Center of Mass (Mend)
The Center of Mass represents the average of all single cell endpoints. Its x and y values indicate the direction, in which the group of cells primarily traveled.
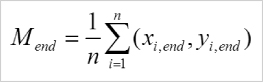
Calculation of the center of mass (Mend). i = index of single cells, n = number of cells, xi,end, yi,end = coordinates of the respective cell endpoint.
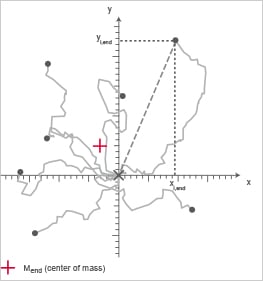
Chemotaxis plot; the Center of Mass is indicated in red.
Directness (D) of Cell Migration
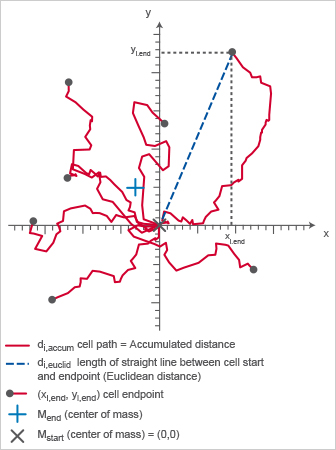
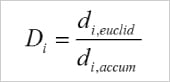
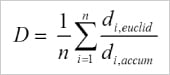
The Directness (sometimes also called directionality) is a measure of the straightness of the cell trajectories. It is calculated by comparing the Euclidean distance (di,euclid) and the accumulated distance (di,accum) between the starting point and the endpoint of a migrating cell. The directness values are always positive. A directness of D = 1 equals a straight-line migration from the start to the endpoint.
Calculation of the directness (D) of one single cell. i = index of the single cell, di,euclid = Euclidean distance, di,accum = accumulated distance. |
Averaged directness of all cells in an experiment. |
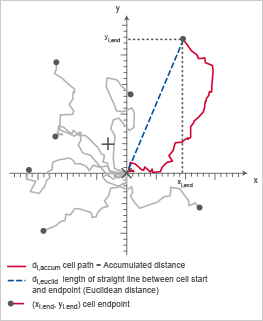
Chemotaxis plot indicating di,accum (red) and di,euclid (blue), which are important to calculate the directness (D).
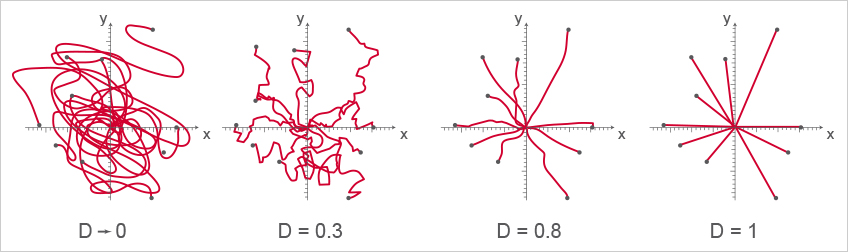
Four examples of cell directness. A directness value approaching 0 indicates indirect, curvy cell migration. A directness value tending towards 1 indicates a straight migration from the start to the endpoint. Note that the cell endpoints are identical in this example.
ibidi Solution
The Chemotaxis and Migration Tool provides chemotaxis plots, graphs, and statistical tests for the advanced analysis of chemotaxis assays. All relevant chemotaxis parameters are automatically calculated. All data can be exported for further analysis. The tool is freely available: Download the Chemotaxis and Migration Tool.
Frequently Asked Questions on Chemotaxis Data Analysis
What does a high FMIII value mean?
A high FMIII value indicates directed cell migration parallel to the chemotactic gradient. In a chemotaxis assay, this suggests that cells migrate preferentially towards the chemoattractant. In contrast, FMI┴ should remain close to zero if migration is specifically directed along the gradient.
How do you confirm significant chemotaxis?
Significant chemotaxis is confirmed by combining trajectory plots, quantitative chemotaxis parameters, and statistical testing. The FMIII of the experimental group should be higher than that of the control groups, FMI┴ should remain close to zero, and the Rayleigh test should show p < 0.05 for the experimental group.
Which parameters are most important for chemotaxis interpretation?
The most important parameters for chemotaxis data interpretation are the Forward Migration Index, Rayleigh test, Center of Mass, and Directness. Together, these values help determine whether cell migration is directional, statistically significant, and specifically guided by a chemoattractant.
What is the purpose of the Rayleigh test in chemotaxis analysis?
The Rayleigh test evaluates whether the distribution of cell endpoints is uniform or directional. A p-value below 0.05 rejects the null hypothesis of uniform distribution and supports a significant chemotactic effect.
Why do all cell tracks start from one point in chemotaxis plots?
For better visualization, the coordinates of all cell trajectories are transformed so that every track starts at x = 0 and y = 0. This is a common procedure in chemotaxis analysis and does not mean that all cells started from the same position in the experiment.
Which data format is needed for the Chemotaxis and Migration Tool?
The Chemotaxis and Migration Tool requires a tab-separated data table containing tracks, slices, and x/y positions of the tracked cells. Datasets generated with the ImageJ Manual Tracking Plugin can be imported directly into the tool.
Can chemotaxis data be analyzed if track data points are missing?
No. The Chemotaxis and Migration Tool rejects tracks with missing data points. Even one missing value prevents the track from being used, so each cell track should be checked for completeness before analysis.
Read on and learn more about the Chemotaxis Assay Workflow: From Sample Preparation to Data Analysis, and Chemotaxis Assays: Principles, Cell Migration Types, and Chamber Systems.