


The environmental temperature strongly influences the metabolism and the activity of cells. Temperature changes affect cell adhesion, protein expression, proliferation, and many more cellular parameters.
Generally, 37°C (which is our normal body temperature) is optimal for mammalian cell culture, including human, mouse, and rat cells. Cells from non-mammalian organisms, such as chick or yeast, require different temperatures.
In order to get robust and reliable results, and to maintain focus stability, the temperature of the cells and their direct environment must be kept as constant as possible during both short-term and long-term live cell imaging experiments.
ibidi Solution
|
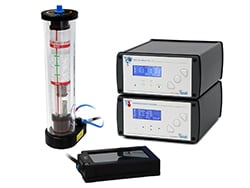
The ibidi Stage Top Incubation Systems provide a stable and homogeneous temperature for live cell imaging experiments. The temperature is smoothly changeable and can easily be adapted to the requirements of the investigated cell type. |
|
Heat-up Curve
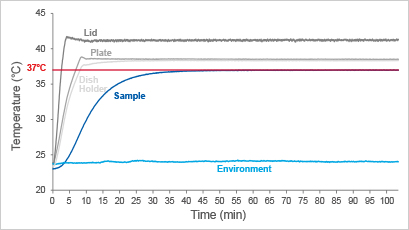
Heat-up curve of the ibidi Heating System Slide/Dish – Silver Line with Dish Holder and µ-Dish 35 mm, high, filled with cell culture medium (Sample). The heat-up curve of the ibidi Heating System was recorded at an environmental temperature of 24°C (± 0.3°C). Plate and Lid reached their target temperature within 10 minutes. After complete equilibration of the sample to 37°C within 40 min, the sample temperature stayed at 37.0°C (± 0.2°C).
Sample Temperature Stability
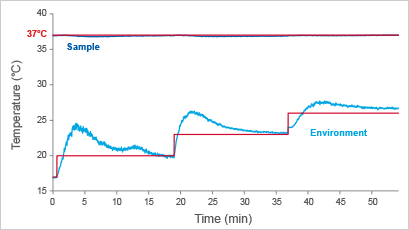
Sample temperature stability inside the ibidi Heating System Slide/Dish – Silver Line with Dish Holder and µ-Dish 35 mm, high, filled with cell culture medium (Sample). After equilibration of the sample inside the Heating System, the environment temperatures were increased stepwise (17°C → 20°C → 23°C → 26°C; max 27.7°C). The temperature of the sample inside the Heating System stably stayed at 36.9°C (± 0.15°C).
Temperature Distribution
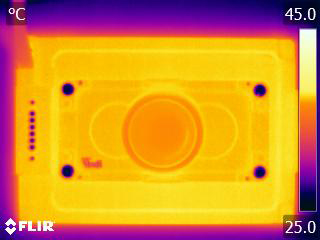

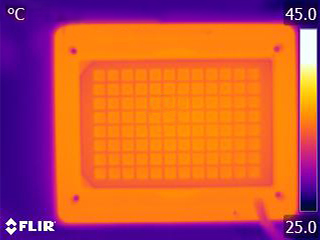
Stable and consistent temperature distribution in every well of a µ-Dish 35 mm, high, a µ-Slide 8 Well high, and a µ-Plate 96 Well Black in the ibidi Stage Top Incubation System. Images were acquired with a FLIR thermal camera. Please note that the pseudocolor scale in the multiwell image is slightly different.
Read on and learn more about the Carbon Dioxide (CO2) Levels in live cell imaging.