


Cells Under Flow: Experimental Examples
- Phase Contrast und Fluorescence Microscopy of Pulmonary Endothelial Cells (HPMECs)
- Immunofluorescence of Flow-Conditioned Endothelial Cells
- Impedance Measurements Under Flow
- Scientific Poster: Changes in cell-cell contacts of endothelial cells (HUVEC) under long term shear stress conditions (PDF)
- Scientific Poster: Defining the Critical Shear Stress Range in Long Term HUVEC Cell Culture (PDF)
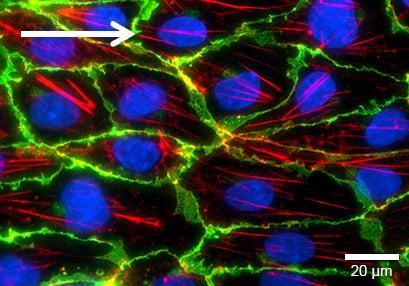
Static culture
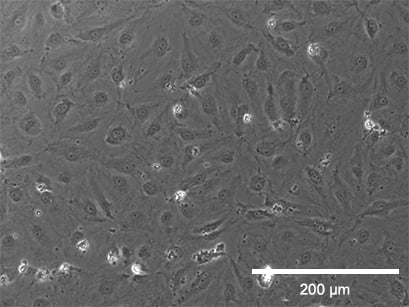
Flow culture
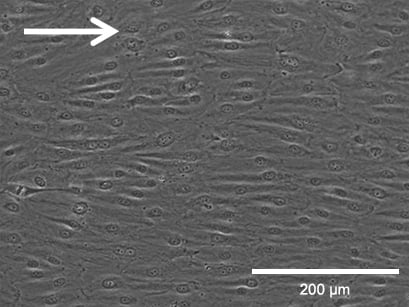

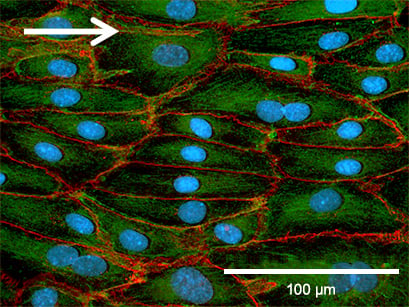
Phase contrast (top, scale bar: 200 µm) and fluorescence (bottom, scale bar: 100 µm) microscopy of HPMECs, comparing static (left) and flow culture (right) at 72h. Fluorescence labels: β-Actin (green), VE-Cadherin (red), DAPI (blue). Data by Daniel Bourquain, Robert Koch Institut, Berlin.
Immunofluorescence Staining of Flow-Conditioned Endothelial Cells
After the flow experiment, immunofluorescence stainings can easily be done in the ibidi Channel Slides. When comparing the cultivation of HUVEC under static and flow conditions, the differences in the cellular organization and various cellular compartments (e.g., tight junctions) are clearly visible.
Find detailed information about immunofluorescence staining in ibidi µ-Slides and µ-Dishes here.
Adherence Junctions (VE-Cadherin)
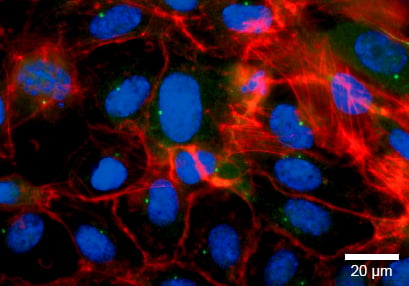
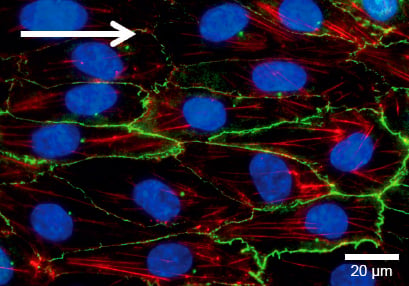
Under static conditions, HUVEC are generally large with a chaotically structured actin skeleton. In contrast, flow-conditioned cells are elongated and show distinct stress fibers. F-actin was stained with phalloidin (red). VE-cadherin (green), which mark the adherence junctions, are present in both conditions. Nuclei are stained using DAPI (blue).
Static culture

HUVECs were cultured at static conditions for 5 days in a µ-Dish 35 mm ibiTreat. The cells were stained for VE-Cadherin (green), F-actin (red), and nuclei (blue). Imaged using a Nikon Eclipse microscope at 60x magnification.
Flow culture
HUVECs were cultured under flow at 10 dyn/cm² for 5 days in a μ-Slide I 0.4 Luer ibiTreat. The cells were stained for VE-Cadherin (green), F-actin (red), and nuclei (blue). Imaged using a Nikon Eclipse microscope at 60x magnification.
Tight Junctions (Claudin-5)
Claudin-5, a tight junction protein, can be found at the cell-cell contact zone of flow-conditioned cells after 5 days (green). This shows that the impact of the mechanical shear stress is crucial for the differentiation of the cell layer. F-actin was stained with phalloidin (red). Nuclei are stained using DAPI (blue).
Static culture
HUVECs were cultured under flow at 0 dyn/cm² for 5 days in a μ-Dish 35 mm ibiTreat. The cells were stained for claudin-5 (green), F-actin (red), and nuclei (blue). Imaged using a Nikon Eclipse microscope at 60x magnification.
Flow culture
HUVECs were cultured under flow at 10 dyn/cm² for 5 days in a μ-Slide I 0.4 Luer ibiTreat. The cells were stained for claudin-5 (green), F-actin (red), and nuclei (blue). Imaged using a Nikon Eclipse microscope at 60x magnification.
Golgi Apparatus
The Golgi apparatus, stained with Anti-Human-Golgin-97 (red), is localized along the direction of flow. F-actin was stained with phalloidin (green). Nuclei are stained using DAPI (blue).
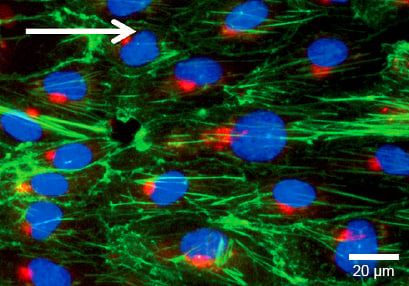
HUVECs were cultured under flow at 10 dyn/cm² for 4 days in a μ-Slide I 0.4 Luer ibiTreat. Cells were stained for Human-Golgin-97 (red), F-actin (green), and nuclei (blue). Imaged using a Nikon Eclipse microscope at 60x magnification.
Von-Willebrand-Factor
The von-Willebrand-Factor (vWF, stained with anti human von-Willebrand-Factor) is a typical endothelial cell marker. When the cells are exposed to flow, the vWF-multimers elongate to rods that are sticking to the cell membrane (green). Nuclei are stained using DAPI (blue).

HUVECs were cultured under flow at 10 dyn/cm² for 5 days in a μ-Slide I 0.4 Luer ibiTreat. The cells were stained for VE-Cadherin (green), F-actin (red), and nuclei (blue). Imaged using a Nikon Eclipse microscope at 60x magnification.
Impedance Measurements Under Flow Stimulation
Mechanical perturbations have a profound effect on the characteristics of cell layers in vitro. In long-term experiments with HUVEC, three different phenotypes can be observed: a round flat cell after seeding, elongated cells after 1–2 days, and finally an oriented cobblestone appearance of a dense, compact cell layer. The morphological changes are accompanied by physiological changes of the endothelial cell monolayer, which can be measured by impedance monitoring.
Working Principle of Impedance Measurements
Cells are cultivated in channels with electrode arrays. Depending on the state of development of the endothelial cell monolayer, the gaps between the cells (influenced by the cell-cell contacts) change in size. These shifting gaps can be characterized by their change in conductivity when applying AC currents of different frequencies. The continuous red lines in the scheme represent the ion currents between the cells when applying the AC current.
For a detailed description, please refer to the applications website "Impedance-Based Cell Assays".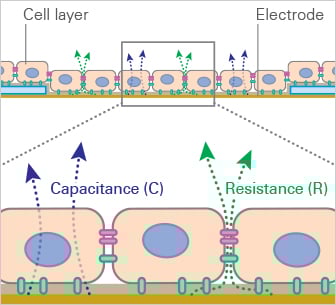
Conductivity and Impedance Change of an Endothelial Cell Monolayer
Static culture

After seeding, cells grow to confluence in 2–3 days. During this time, the conductivity is reduced, and the resistance rises to a plateau, which is then maintained under the subsequent static culturing over several days.
Flow culture
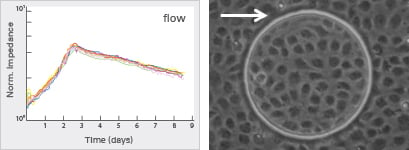
Applying shear stress reduces the conductivity and increases the impedance of the monolayer. Over a period of days the impedance of the endothelial monolayer decreases. The physiological properties of the cell monolayer are altered when compared to the static conditions.
Read on and get an overview about Cell Culture Under Flow, or learn more about the Planning, Setup, and Analysis of a Flow Assay.