



User Protocol 17:
Protocol for Single Cell Analysis With the µ-Pattern ibiTreat
Judith Müller, Gerlinde Schwake*, Daniel Woschee
Faculty of Physics and Center for NanoScience, Ludwig Maximilians-Universität, Munich, Germany
*Corresponding author, e-mail: Gerlinde.Schwake@physik.lmu.de
Cells within a population differ in their morphology, gene expression levels, or differentiation status. This results in variances within populations. To account for this variability in cell experiments, single cells should be analyzed instead of averaging over the population. The µ-Pattern ibiTreat technology provides the possibility to adhere and cultivate single cells on confined spots in a predefined pattern over a long-term period. This “capturing” of cells on one spot allows tracking and analyzing individual cells over time. The µ-Pattern ibiTreat can be combined with different protein coatings, optimized for the respective cell line used in the experiment.
This User Protocol provides an example for single-cell gene expression analysis experiments including all steps from protein coating, cell seeding, transfection, imaging, and analysis of the fluorescence signal of single cells.
1. Related Documents
2. Materials and Reagents
Cells and Reagents
- HuH7 (JCRB Cell Bank - JCRB0403)
- Coating protein: Laminin (BioLamina, LN521-02)
- Material for transfection:
- OptiMEM (Gibco, 11085-021)
- Lipofectamine 2000 (ThermoFisher, 11668027)
- mRNA (generated in-house, mRNA encoding eGFP)
- Others:
- Leibovitz L-15 medium without phenol red (ThermoFisher, 21083027)
- Sterile PBS
- Sterile water
Culture Media
- RPMI 1640 Medium with GlutaMAX Supplement (ThermoFisher, 61870036):
- 10% FBS (ThermoFisher, 10437028),
- 5 mM HEPES (ThermoFisher, 15630080),
- 1 mM sodium pyruvate (ThermoFisher, 11360039)
Equipment
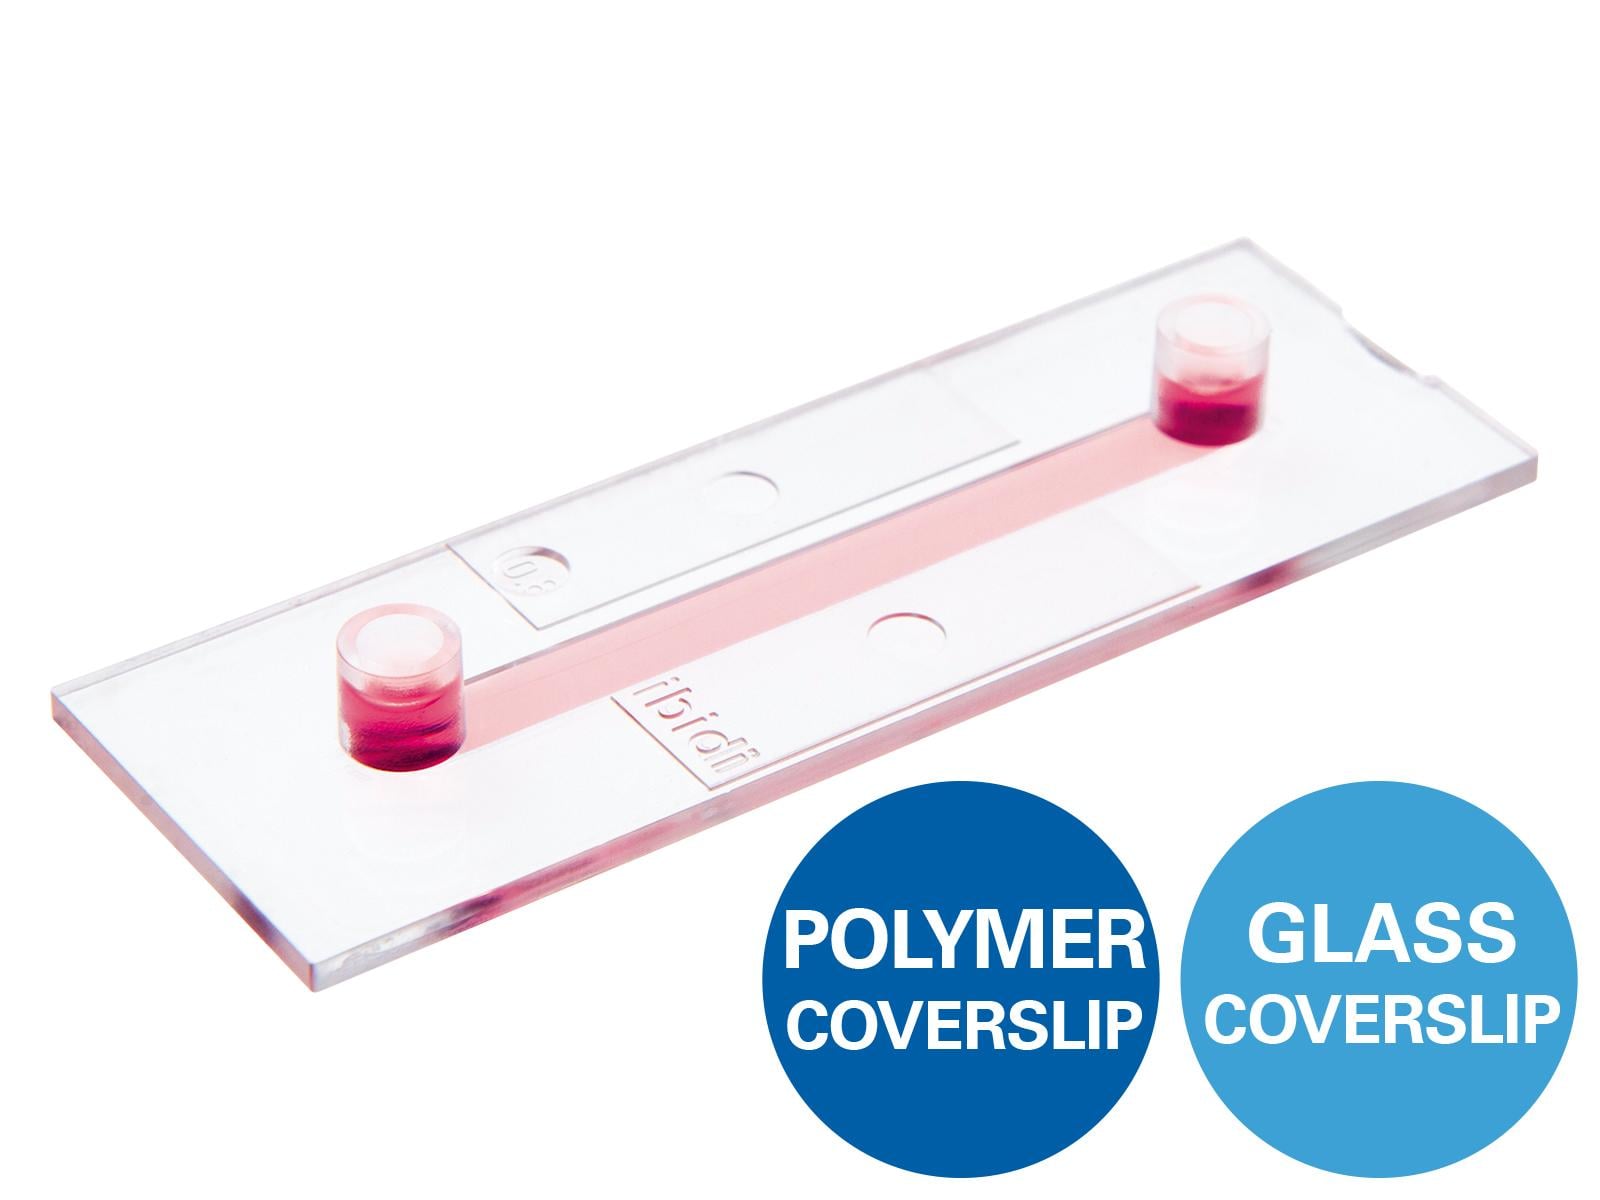
- µ-Slide VI 0.4 µ-Pattern ibiTreat, sqr30, pit75, hex (ibidi, 83611)
- Microscope: Nikon TI Eclipse
3. Procedure
Note: The number of cells and protein concentration used depends on the cell line and the available pattern area.
3.1 Coating of the Channels
A protein amount per area of 2–5 µg/cm2 is recommended.
- Dilute the laminin with sterile PBS to prepare a 20 µg/ml working solution.
- Rinse the channel with sterile PBS.
- Empty the channel and add 30 µl of the coating working solution.
- Incubate the slide for 1 hour at 37°C.
- Wash multiple times with sterile PBS (1 ml PBS, at least 3 times) and proceed to cell seeding.
3.2 Cell Seeding
- Exchange the PBS in the channel with cell culture medium. Use 150 µl of the medium two times to make sure the complete PBS was replaced by cell culture medium.
- Harvest the cells and resuspend them in the cell culture medium at a concentration of 5 × 10⁵ cells/ml.
- Add 50 µl of the cell solution (2.5 × 10⁴ cells) to each channel. Aspirate excess medium from the opposite Luer port and incubate the slide in the incubator at 37°C for 1 hour (the time varies between different cell lines and different coatings).
- Check for cell adhesion under the microscope by carefully moving the slide. If the cells are positioned and do not move anymore, carefully wash the channel with 150 µl cell culture medium.
- Incubate the cells at 37°C for 1–2 hours, until the cells completely adhere to the pattern.
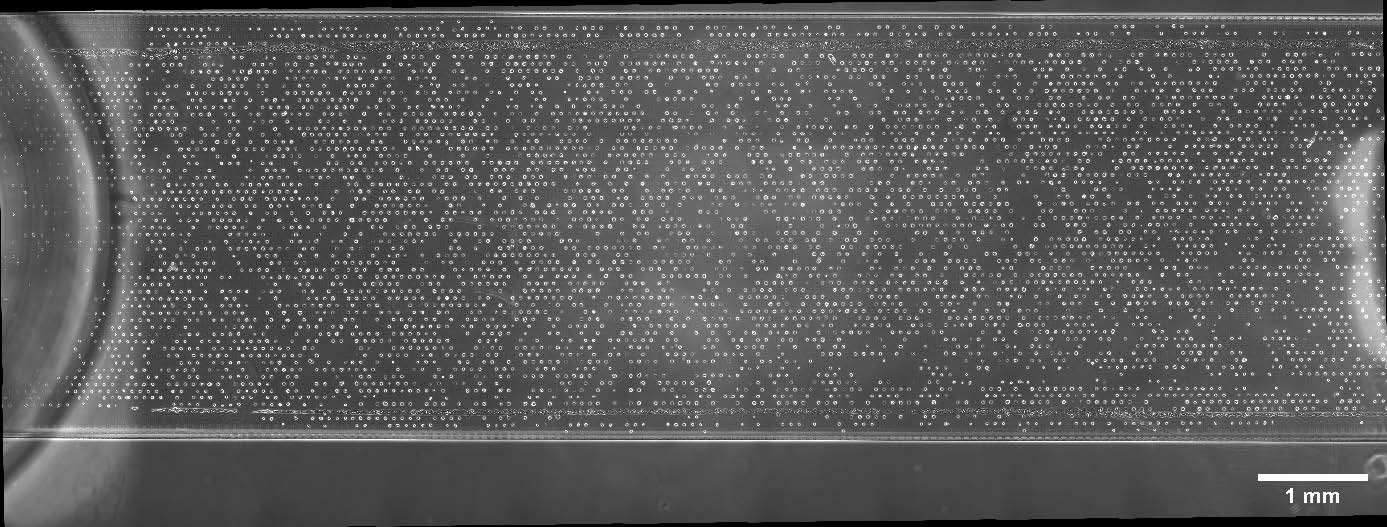
Figure 1. Stitching with a 10× objective of one complete channel of the µ-Slide VI 0.4 µ-Pattern ibiTreat, sqr30, pit75, hex. Cells are homogeneously distributed and mostly only one cell adheres to one pattern spot. Image was taken after 30 hours.
3.3 Cell Transfection
In the following steps, the transfection reagent must be prepared for a final mRNA amount of 50 ng per channel in 50 µl.
- After cell adhesion, gently wash each channel with 150 µl OptiMEM.
- Incubate for 1 hour at 37°C.
- Wash again with 150 µl OptiMEM.
- Prepare the transfection mix.
Dilute the mRNA (stock concentration 1 µg/µl) with sterile water to 0.1 µg/µl. Prepare two solutions:- Mix A: 2 µl Lipofectamine 2000 + 398 µl OptiMEM, incubate for 5 minutes at room temperature
- Mix B: 98 µl OptiMEM + 2 µl mRNA (0.1 µg/µl)
- Pipette 50 µl transfection mix into the channel.
- Incubate transfection mix with the cells for 1 hour at room temperature.
- Wash twice with L-15 medium.
- For imaging without CO2 incubation, add 100 µl L-15 medium. If CO2 gas incubation is available, use standard cell culture medium without phenol red.
3.4 Acquisition of Microscopy Images
- Place the slide on the microscope.
- Use a 10× objective lens.
- Define different positions in the channel.
- Record images in brightfield and the desired fluorescence (GFP channel) every 10 minutes for up to 30 hours.
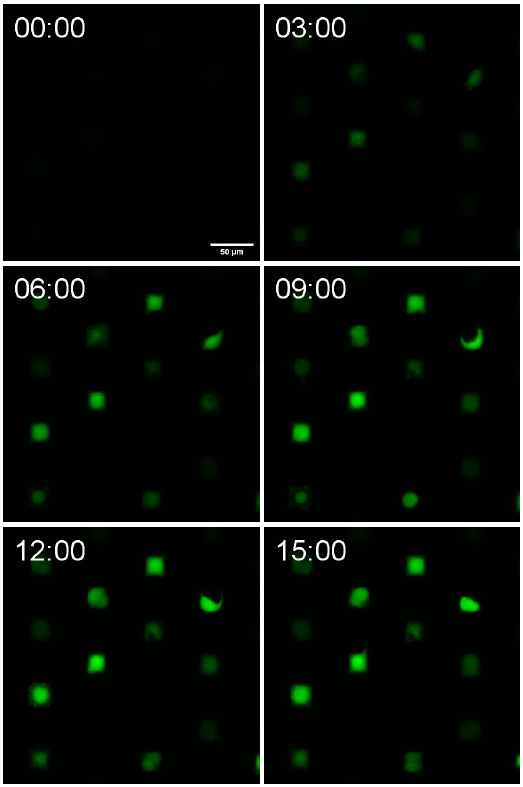
Figure 2. Time-lapse images of the fluorescence signal at 0, 3, 6, 9, 12, and 15 hours with a 10× objective. With increasing time, the intensity of the signal increases and more cells start to express eGFP.
4. Analysis of the Fluorescence Signal of Single Cells
The intensity of the fluorescence signal and corresponding gene expression kinetics parameters can be determined for each single cell. Confinement on the µ-Pattern reduces cell movement and therefore simplifies tracking of the same cells over time based on brightfield images and to extract fluorescence intensity over time.
4.1 PyAMA: Automated Microstructure Analysis in Python
The gene expression analysis of fluorescent reporters can automatically be done using the software "PyAMA". PyAMA stands for “Automated Microstructure Analysis in Python” and is a Python-based application for displaying and reading single cell fluorescence time courses from TIFF stacks created by time-lapse fluorescence microscopy. The software is open-source and available on GitHub: https://github.com/SoftmatterLMU-RaedlerGroup/pyama.
The current updated version is called PyAMA_v2. A short documentation of PyAMA_v2 is found under https://github.com/SoftmatterLMU-RaedlerGroup/pyama-v2.
For a detailed description of the interpretation of fluorescence time courses based on a mathematical kinetic rate model we refer to:
Reiser A, Woschee D, Kempe SM et al. (2021) Live-cell Imaging of Single-Cell Arrays (LISCA) – a Versatile Technique to Quantify Cellular Kinetics. J. Vis. Exp. 169: e62025, doi: 10.3791/62025
Judith A. Müller, Nathalie Schäffler, Thomas Kellerer, Gerlinde Schwake, Thomas S. Ligon, Joachim O. Rädler "Kinetics of RNA-LNP delivery and protein expression" (2024) European Journal of Pharmaceutics and Biopharmaceutics 197, 114222, doi: 10.1016/j.ejpb.2024.114222
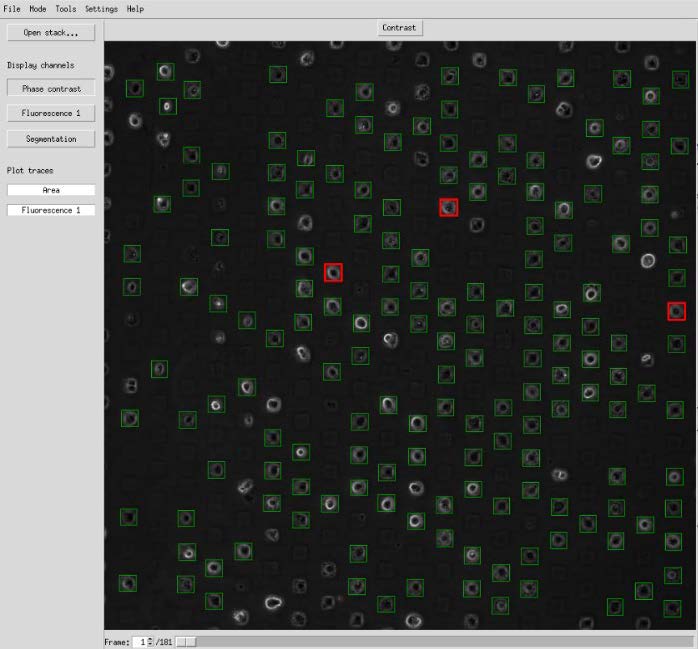
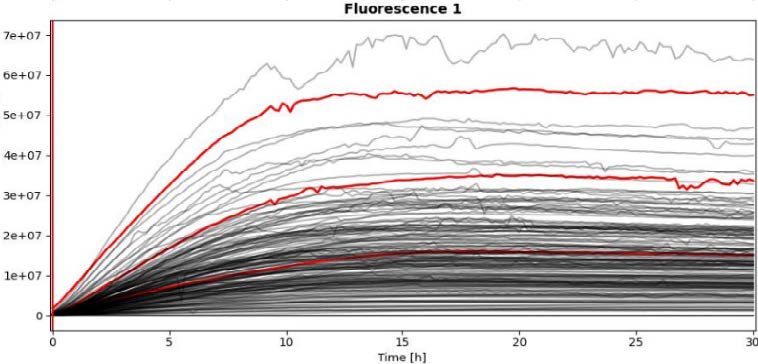
Figure 3. Screenshot of the analysis with PyAMA. All analyzed cell spots are marked in green in the overview image. The graph shows the fluorescence over time of all analyzed cell spots. The three selected curves are marked in red in the overview image. The fluorescence intensity increases over time. The expression of eGFP and the increase in intensity are individual for each cell.
This User Protocol is an ibidi peer-reviewed protocol from an actual user. ibidi does not guarantee its functionality or reproducibility. For this User Protocol, ibidi provides only limited support. Please contact the corresponding author for detailed information.
For research use only.