




User Protocol 16:
Protocol for T Cell-Mediated Cell Killing Assay on the µ-Pattern ibiTreat
Wenqing Xu1, Anna S. Herbstritt1, Angelika J. Fischbeck1, Daniel Rüdiger2, Marisa Seiwald2, Elfriede Noessner1*
1 Immunoanalytics, IMA-TCI, Helmholtz Center Munich, Germany
2 ibidi GmbH, Gräfelfing, Germany
*Corresponding author, e-mail: elfriede.noessner@helmholtz-munich.de
Immunotherapies, which harness the potency of T cells to kill tumor cells, have changed the landscape of clinical oncology (Waldman, Fritz, and Lenardo 2020). One of the most significant improvements in clinical outcome has been achieved through the introduction of monoclonal antibodies that block the interaction between the programmed cell death protein 1 (PD-1), an immune checkpoint receptor expressed on T cells, and its ligand PD-L1 expressed on tumor cells (Sharma et al. 2023). T cell engineering with synthetic chimeric antigen receptors (CARs) or natural tumor-specific T cell receptors (TCRs) allows the ex vivo generation of various T cells with tumor specificity (Zhao and Cao 2019). To select the most effective T cells for clinical application, and to investigate whether immune checkpoint blockade can improve killing efficacy, an in vitro screening platform with high-throughput capacity and statistical robustness is required.
The µ-Pattern ibiTreat provides such a high-throughput screening platform. The microstructured surface creates numerous confined reaction compartments for individual analysis, allowing multiple replicates and statistical robustness within a single experiment. Being versatile in application, it is particularly useful to assess immune cell-mediated tumor cell killing efficacy. This protocol describes an example workflow for a tumor cell killing assay using tumor cells and T cells, together with the corresponding analysis performed on a patterned surface.
1. Related Documents
- Instructions µ-Slide 8 Well high µ-Pattern ibiTreat, cir200, pit600, hex (PDF)
- Instructions Collagen Type I, Rat Tail, 5 mg/ml (PDF)
- Instruction Manual ibidi Heating System Slide/Dish – Silver Line (PDF)
- Instruction Manual ibidi Gas Incubation System – Silver Line (PDF)
2. Materials and Reagents
Cells and Reagents
- RCC-26 and RCC-53 cells: adherent growing human renal cell carcinoma cell lines, established from tumor tissue, Helmholtz Munich (Djafarzadeh et al. 2006)
- TCR53/CD8-T cells: human primary T cells retrovirally transduced to express the antigen-specific, HLA-A2-restricted T cell receptor TCR53 (Leisegang et al. 2010), which recognizes the selected tumor cells RCC-26 and RCC-53
- Collagen Type I, Rat Tail (ibidi, 50201)
- anti-PD-1 antibody (BioLegend, 329926)
- anti-PD-L1 antibody (BioLegend, 329716)
- PBS (Gibco, 14190-094)
- 0.01 M HCl (Merck, 109057)
Culture Media
- RPMI 1640 (Gibco, 31870) supplemented with
- 10% FCS (Anprotec, AN-S006G)
- 1% Pen/Strep (Gibco, 15140-122)
- 2 mM L-glutamine (Gibco, 25030)
- 1× non-essential amino acids (Gibco, 11140-035)
- 1 mM sodium pyruvate (Gibco, 11360-039)
Equipment
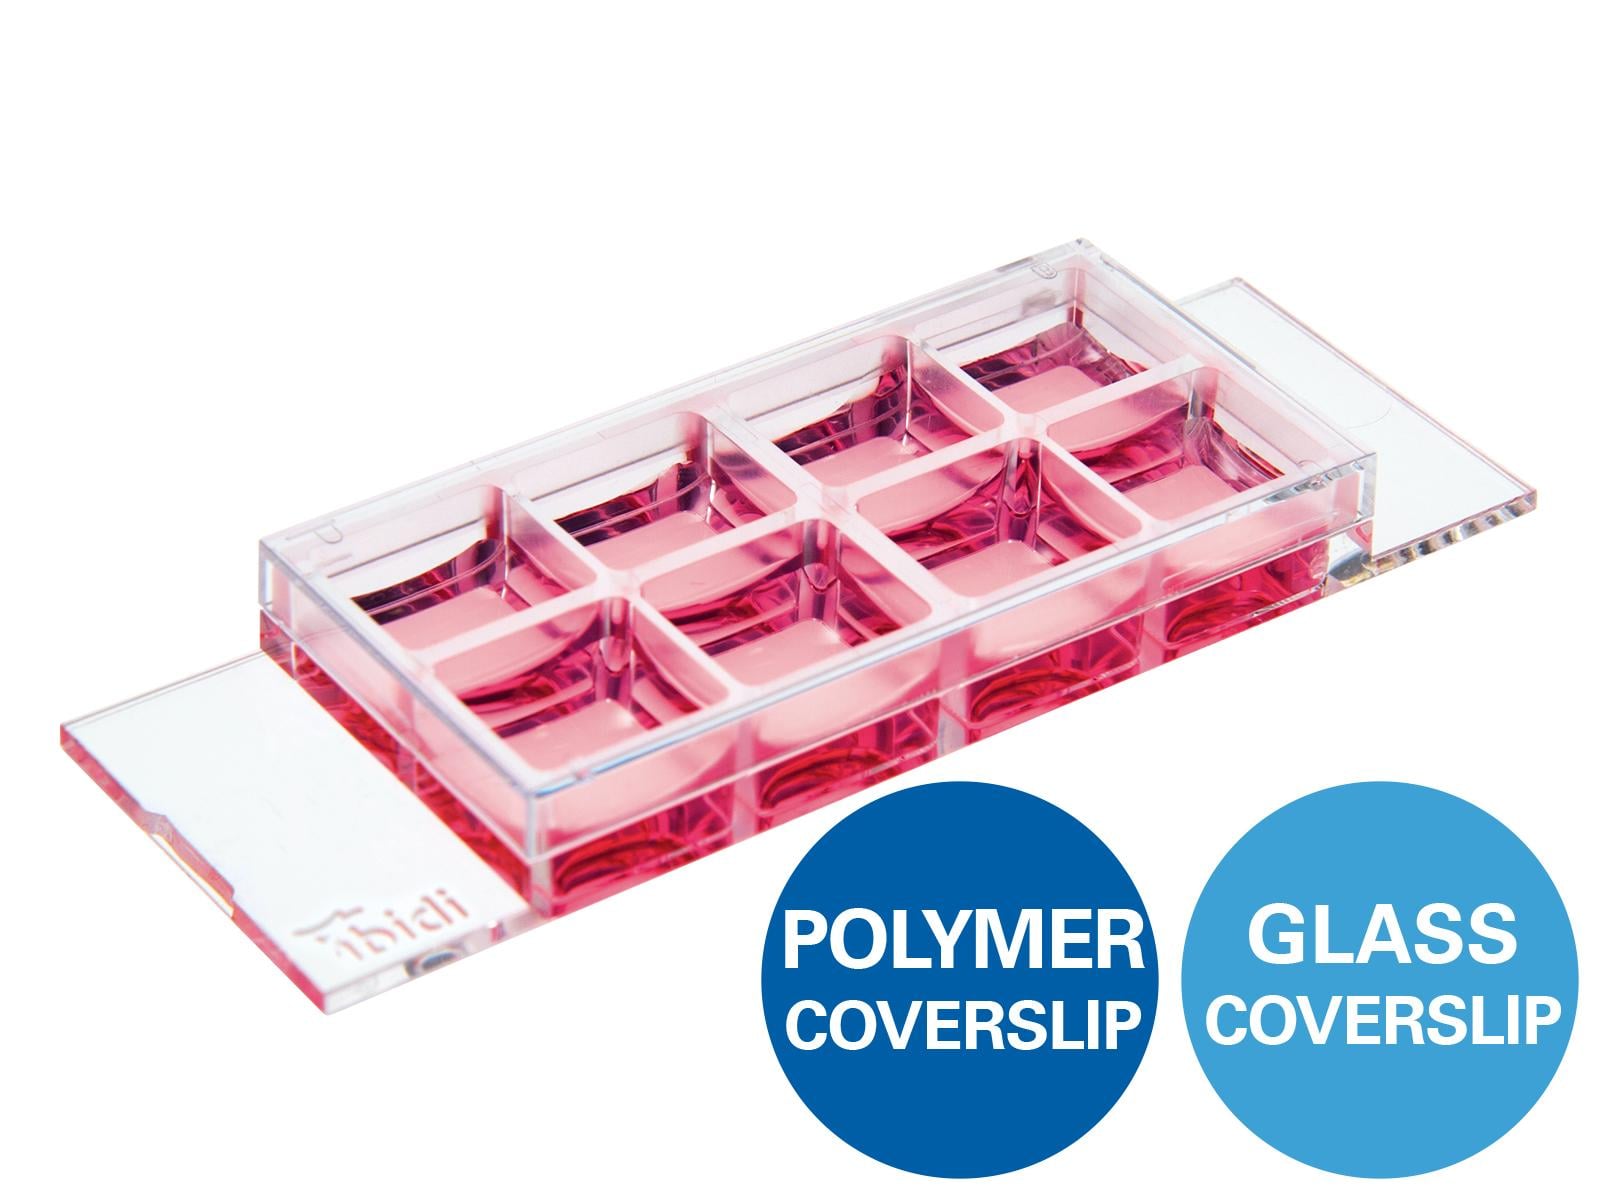
- µ-Slide 8 Well high µ-Pattern ibiTreat, cir200, pit600, hex (ibidi, 83812)
- Microscope: Brightfield, 4× objective lens, automated stage
- Stage Top Incubator 37°C, 5% CO2 (adapted from the ibidi Stage Top Incubator, 12722)
Background Information on Used Material
RCC-26 and RCC-53 are two clear cell renal cell carcinoma cell lines (ccRCC), established from the primary tumor of two patients with different tumor stages and metastatic status. RCC-26 was established from a well differentiated, small, early-stage tumor, which had not metastasized at the time of diagnosis. In contrast, RCC-53 was generated from a dedifferentiated large, late-stage tumor, which has already metastasized to various organs.
TCR53/CD8-T cells are human primary T cells that have been transduced to express the T cell receptor TCR53 together with the co-receptor CD8. TCR53 has HLA-A2-restricted specificity for RCC-26 and RCC-53, stimulating cytokine release and cytotoxicity.
When T cells enter the tumor milieu, loss of function is often observed (Blohm et al. 2002; Frey and Monu 2006; Schietinger et al. 2016; Prinz et al. 2012). Different studies attribute this to an inhibitory role of the tumor microenvironment, which promotes immune escape and prevents tumor cell elimination (Gajewski, Meng, and Harlin 2006; Fischbeck et al. 2020; Frankenberger, Noessner, and Schendel 2007). One mechanism is the upregulation of immune-inhibitory receptors such as PD-1 on T cells, unleashing an inhibitory signaling pathway to the T cell when binding to its ligand PD-L1 on tumor cells (Baumeister et al. 2016). To explore the involvement of PD-1/PD-L1 inhibition in the context of T cell-mediated killing efficacy, antibodies against PD-1 and PD-L1, which block the interaction, can be added to the T cell/tumor cell co-cultures.
3. Procedure
3.1 Coating of the Wells
To describe the influence of T cells and their cell killing effect, the tumor cells should be vital and well adhered to the pattern. An appropriate coating enables good adhesion of the tumor cells. Some cells can also adhere directly to the ibiTreat surface. This might lead to a change in cell behavior and, thus, might influence the cell killing process. Depending on the cell type used, different coating conditions in terms of the used protein, its concentration, coating time, and washing steps, may be selected for optimal cell adhesion. The optimal coating conditions should be determined in pilot experiments.
For the RCC cell lines used here, the procedure was as follows:
- Dilute the collagen I in 0.01 M HCl to 10 µg/ml.
- Add 150 µl of Collagen Type I coating solution per well.
- Incubate the slide for 1 hour at 37°C.
- Wash 5 times with 300 µl sterile PBS.
3.2 Tumor Cell Seeding
The patterns should be covered with an optimal number of cells. It is critical to carefully establish cell seeding concentration and culturing conditions that yield optimal confluency with a tumor cell monolayer for most patterns. The cells should not be densely packed and not grow on top of each other, as a too high cell density can influence cell behavior. A confluent monolayer can be achieved directly after seeding the right cell number or by proliferation over time.
Depending on the cell size, it is necessary to select a suitable pattern size. The cell concentration used for seeding, incubation duration, washing time and steps must be adjusted for every cell type. The optimal seeding conditions should be determined in pilot experiments.
For the RCC-26 and RCC-53 cells, optimal confluence, yielding a tumor cell monolayer, was achieved with a seeding concentration of 2.5 × 10⁴ cells/ml, 5-hour attachment time, and additional 12–16 hours of culture at 37°C after the initial attachment and washing steps.
For the RCC cell lines used in this protocol, the procedure was as follows:
- Dilute the tumor cells to the pre-defined optimal cell concentration in medium. RCC cells are large cells and were best seeded at a cell concentration of 2.5 × 10⁴ cells/ml.
- Add 300 µl of the cell suspension per well.
- Incubate the cells for 5 hours in the incubator at 37°C to allow cell attachment.
- Carefully wash three times with 300 µl medium to remove non-adhered cells.
- Observe pattern confluency under the microscope.
3.3 T Cell Addition
After the tumor cells have been grown confluently, the cell killing assay starts by adding the T cells. It is recommended to use a control well, which is seeded with tumor cells but without T cells. This well is observed to detect spontaneous cell death or other changes in cell survival over the duration of the experiment. Inclusion of the control in the analysis provides an accurate description of T cell-induced cell killing. Other controls, like tumor cells, which are not recognized by the used T cell, might deliver additional information on the T cell killing behavior.
- Prepare the following T cell solutions:
- 2.5 × 10⁴ cells/ml T cells
- 2.5 × 10⁴ cells/ml T cells with 20 µg/ml of each anti-PD-1 and anti-PD-L1 antibody
- Medium without T cells as control
- Replace the medium of each well seeded with tumor cells with 300 µl of the T cell suspension/control suspension.
Note: Work fast, as cells should not dry out on the well surface.
3.4 Acquisition of Microscopy Images
Depending on the cell type and killing rate, it may be necessary to start imaging quickly to avoid missing initial events. To achieve this, it is advised to preselect the positions to be imaged prior to T cell addition and to readjust them quickly, if necessary. Select positions with patterns which have a confluency of nearly 100% with a single layer of cells (no tumor cells on top of each other). Depending on the cell types used and the cell killing effect, the experiment duration and imaging interval can differ.
- Place the slide on the microscope with incubation chamber, 37°C and 5% CO2.
- Define at least 2 positions to be imaged in each well, each position includes several patterns depending on the size of the µ-Pattern ibiTreat slide and objective magnification. For example, with the settings of the protocol, 4–5 patterns could be observed when using a 200 µm µ-Pattern ibiTreat slide with a 4× objective magnification.
- Record images in brightfield in short intervals (10 min) for the first 3 hours followed by extended intervals of 2 hours until the end of the experiment (here: 3 days).
4. Quantifying T Cell-Mediated Killing Efficacy by Live Cell Imaging on Pattern Slides
Killing efficacy is assessed by evaluating the pattern confluency at each time point over 75 hours during T cell/tumor cell co-culture. The evaluation starts with patterns having a near-confluency of a single layer of tumor cells at the time of T cell addition. For each co-culture condition, 9 patterns were analyzed and followed over time. Example images are displayed in Figure 1.
The mean value of confluency of the 9 selected patterns was calculated at each time point and displayed on the Y axis against the time (h) on the X axis (Figure 2).
At early time points (00:40 hours), all patterns showed 100% confluence. The control condition without T cells (first and third row Figure 1) showed no reduction in confluency over time, indicating that no T cell independent cell death occurs. In co-cultures of RCC-26 cells with TCR53/CD8 T cells (second row Figure 1, red line Figure 2), the confluency decreased quickly showing less than 50% pattern coverage after 07:40 hours, and patterns were empty after 35:40 hours. In co-cultures of RCC-53 cells with TCR53/CD8 T cells (fourth row Figure 1, blue line Figure 2), pattern coverage was still at 100% after 07:40 hours and reduction was less than 50% after 49:40 hours. With the addition of antibodies against PD-1 and PD-L1 to the co-cultures of RCC-53 cells with TCR53/CD8 T cells (fifth row Figure 1, dashed yellow line Figure 2) the confluency decreased faster compared to the TCR53/CD8-RCC-53 co-culture without antibodies.
These results demonstrate that the RCC-26 cells were killed much faster and more efficiently than the RCC-53 cells by the TCR53/CD8 T cells. The addition of antibodies against PD-1 and PD-L1 improved the killing efficacy of the TCR53/CD8 T cells against the RCC-53 tumor cells. However, the level of killing did not reach that observed for RCC-26 cells.
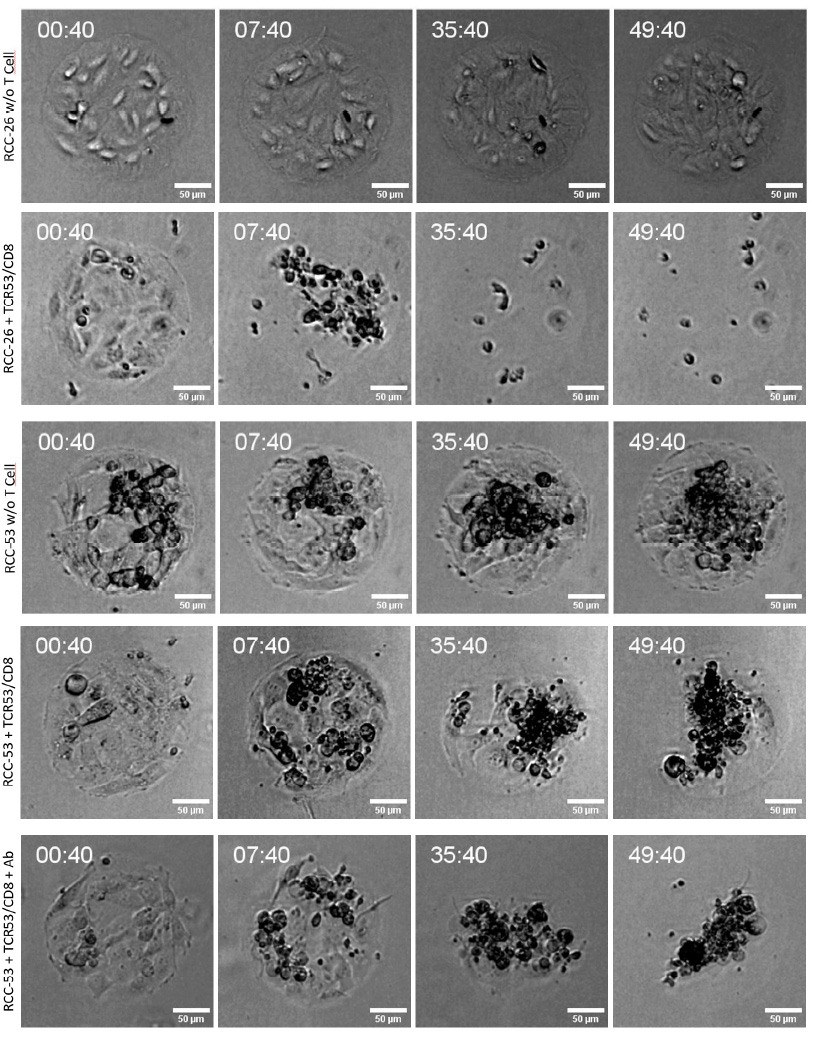
Figure 1. Time-lapse images of TCR53/CD8 T cell co-cultures with either RCC-26 or RCC-53 tumor cells. Example images after 00:40, 07:40, 35:40, and 49:40 hours are displayed. Control wells without T cells showed no reduction in confluency over time (RCC-26 first row, RCC-53 third row). RCC-26 cells with TCR53/CD8 T cells showed the fastest confluency decrease: after 07:40 hours less than 50% pattern coverage and after 35:40 hours the patterns were empty (second row). RCC-53 cells with TCR53/CD8 T cells showed slower change in confluence: 50% of the patterns were still covered after 49:40 hours (fourth row). The addition of antibodies against PD-1 and PD-L1 accelerated the decrease of confluence for RCC-53 with TCR53/CD8 T cells: after 35:40 hours only 50% of the patterns were covered (fifth row).
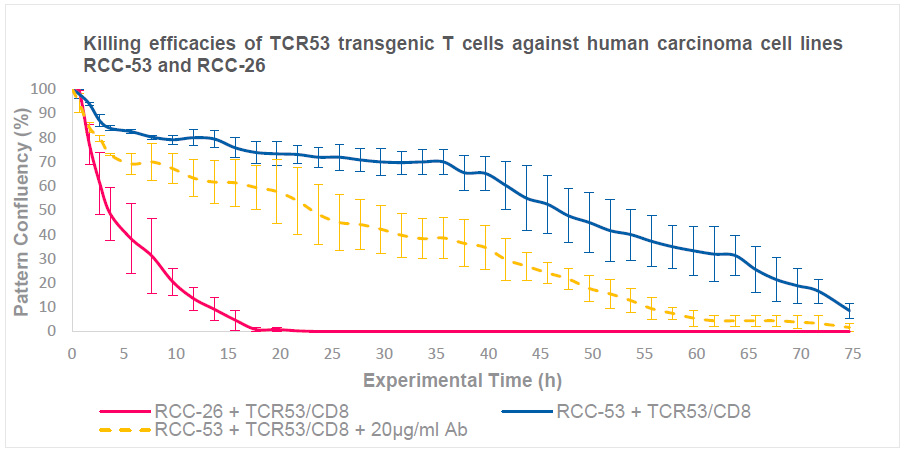
Figure 2. T cell-mediated killing assay using TCR53/CD8 T cells and RCC-26 or RCC-53 tumor cell lines. Analysis of the killing efficacy based on the confluency of the patterns. TCR53/CD8-T cells decreased the confluency of RCC-26 seeded patterns (red solid line) much faster than those seeded with RCC-53 cells (blue solid line), indicating more efficient killing of RCC-26 cells. The killing of RCC-53 cells was improved by adding anti-PD-L1/PD-1 antibodies (dashed yellow line) but did not reach the level observed for RCC-26 cells. For each condition, 9 individual patterns were evaluated and mean values with standard deviation were calculated.
5. Conclusion
It was observed that the same T cell population had different killing efficacies depending on the tumor cell lines. In this example, the same TCR53-transgenic T cells killed RCC-26 tumor cells much more efficiently than the RCC-53 tumor cell line. It was further documented that the killing efficacy can be improved with the addition of checkpoint blocking antibodies, anti-PD-1/anti-PD-L1.
The results demonstrate the suitability of the µ-Pattern ibiTreat slide as a high-throughput system for T cell-mediated killing assays. The multiwell slides allow the investigation of different conditions, i.e. different tumor cell lines, different media supplements, or different T cells, in one experiment. Through the multi-array format, each condition encompasses multiple pattern replicates for individual data collection which enables statistical assessment.
6. References
- Baumeister, S. H., G. J. Freeman, G. Dranoff, and A. H. Sharpe. 2016. 'Coinhibitory Pathways in Immunotherapy for Cancer', Annu Rev Immunol, 34: 539-73.
- Blohm, U., E. Roth, K. Brommer, T. Dumrese, F. M. Rosenthal, and H. Pircher. 2002. 'Lack of effector cell function and altered tetramer binding of tumor-infiltrating lymphocytes', Journal of Immunology, 169: 5522-30.
- Djafarzadeh, R., E. Noessner, H. Engelmann, D. J. Schendel, M. Notohamiprodjo, I. von Luettichau, and P. J. Nelson. 2006. 'GPI-anchored TIMP-1 treatment renders renal cell carcinoma sensitive to FAS-meditated killing', Oncogene, 25: 1496-508.
- Fischbeck, A. J., S. Ruehland, A. Ettinger, K. Paetzold, I. Masouris, E. Noessner, and A. N. Mendler. 2020. 'Tumor Lactic Acidosis: Protecting Tumor by Inhibiting Cytotoxic Activity Through Motility Arrest and Bioenergetic Silencing', Front Oncol, 10: 589434.
- Frankenberger, B., E. Noessner, and D. J. Schendel. 2007. 'Immune suppression in renal cell carcinoma', Semin Cancer Biol, 17: 330-43.
- Frey, A. B., and N. Monu. 2006. 'Effector-phase tolerance: another mechanism of how cancer escapes antitumor immune response', Journal of Leukocyte Biology, 79: 652-62.
- Gajewski, T. F., Y. Meng, and H. Harlin. 2006. 'Immune suppression in the tumor microenvironment', J Immunother, 29: 233-40.
- Leisegang, M., A. Turqueti-Neves, B. Engels, T. Blankenstein, D. J. Schendel, W. Uckert, and E. Noessner. 2010. 'T-cell receptor gene-modified T cells with shared renal cell carcinoma specificity for adoptive T-cell therapy', Clin Cancer Res, 16: 2333-43.
- Prinz, P. U., A. N. Mendler, I. Masouris, L. Durner, R. Oberneder, and E. Noessner. 2012. 'High DGK-α and disabled MAPK pathways cause dysfunction of human tumor-infiltrating CD8+ T cells that is reversible by pharmacologic intervention', J Immunol, 188: 5990-6000.
- Schietinger, A., M. Philip, V. E. Krisnawan, E. Y. Chiu, J. J. Delrow, R. S. Basom, P. Lauer, D. G. Brockstedt, S. E. Knoblaugh, G. J. Hämmerling, T. D. Schell, N. Garbi, and P. D. Greenberg. 2016. 'Tumor-Specific T Cell Dysfunction Is a Dynamic Antigen-Driven Differentiation Program Initiated Early during Tumorigenesis', Immunity, 45: 389-401.
- Sharma, P., S. Goswami, D. Raychaudhuri, B. A. Siddiqui, P. Singh, A. Nagarajan, J. Liu, S. K. Subudhi, C. Poon, K. L. Gant, S. M. Herbrich, S. Anandhan, S. Islam, M. Amit, G. Anandappa, and J. P. Allison. 2023. 'Immune checkpoint therapy-current perspectives and future directions', Cell, 186: 1652-69.
- Waldman, A. D., J. M. Fritz, and M. J. Lenardo. 2020. 'A guide to cancer immunotherapy: from T cell basic science to clinical practice', Nat Rev Immunol, 20: 651-68.
- Zhao, L., and Y. J. Cao. 2019. 'Engineered T Cell Therapy for Cancer in the Clinic', Front Immunol, 10: 2250.
This User Protocol is an ibidi peer-reviewed protocol from an actual user. ibidi does not guarantee its functionality or reproducibility. For this User Protocol, ibidi provides only limited support. Please contact the corresponding author for detailed information.
For research use only.