



User Protocol 06:
Protocol for 2D Invasion Assay
Aniello Federico*, Jochen Utikal
Skin Cancer Unit, German Cancer Research Center (DKFZ), 69120 Heidelberg, Germany.
*Corresponding author. E-mail address: a.federico@dkfz-heidelberg.de
To investigate the motility and the invasive properties of tumor cells under the influence of the tumor microenvironment, an in vitro 2D invasion system was established. This 2D invasion system is a co-culture assay consisting, in this case, of tumor and stromal cells (e.g., fibroblasts). Once both cell types are put into contact, the amount of tumor cells which have invaded the fibroblast monolayer is assessed under different conditions. In our study, we aimed to simulate the conditions found in a solid-tumor microenvironment such as the interaction with stromal cells (fibroblasts) and soluble factors released by fibroblasts (Nnetu et al., 2012). We performed this assay using A375 melanoma cell lines and dermal fibroblasts. Melanoma cells activate fibroblasts which in turn sustain tumor cell growth, malignant transformation, and drug resistance (Flach et al., 2011). Upon stimulation of the tested anticancer compound, however, we saw that the melanoma cells that were in direct contact with fibroblasts showed impaired motility and failed to invade the fibroblast layer.
1. Materials and Reagents
- GFP-A375 Cell line (ATCC)
- Tomato-dermal fibroblast cells (isolated from healthy patient)
- MEF cell culture medium (See Note 1)
- PBS (Sigma-Aldrich; D8537)
- Trypsin-EDTA solution (Sigma-Aldrich; T3924)
- Trypan blue solution (Sigma-Aldrich; 93595)
- DMSO (Carl Roth; A994.2), used at 0.1% final concentration.
- Mithramycin A (Bio Trend; 10-2085-5mg), used at 300 nM concentration, diluted in DMSO
2. Equipment
- Laminar Flow Hood
- 12/24 Well Multiwell Plates (Greiner Bio-One)
- Bench centrifuge
- Haemocytometer
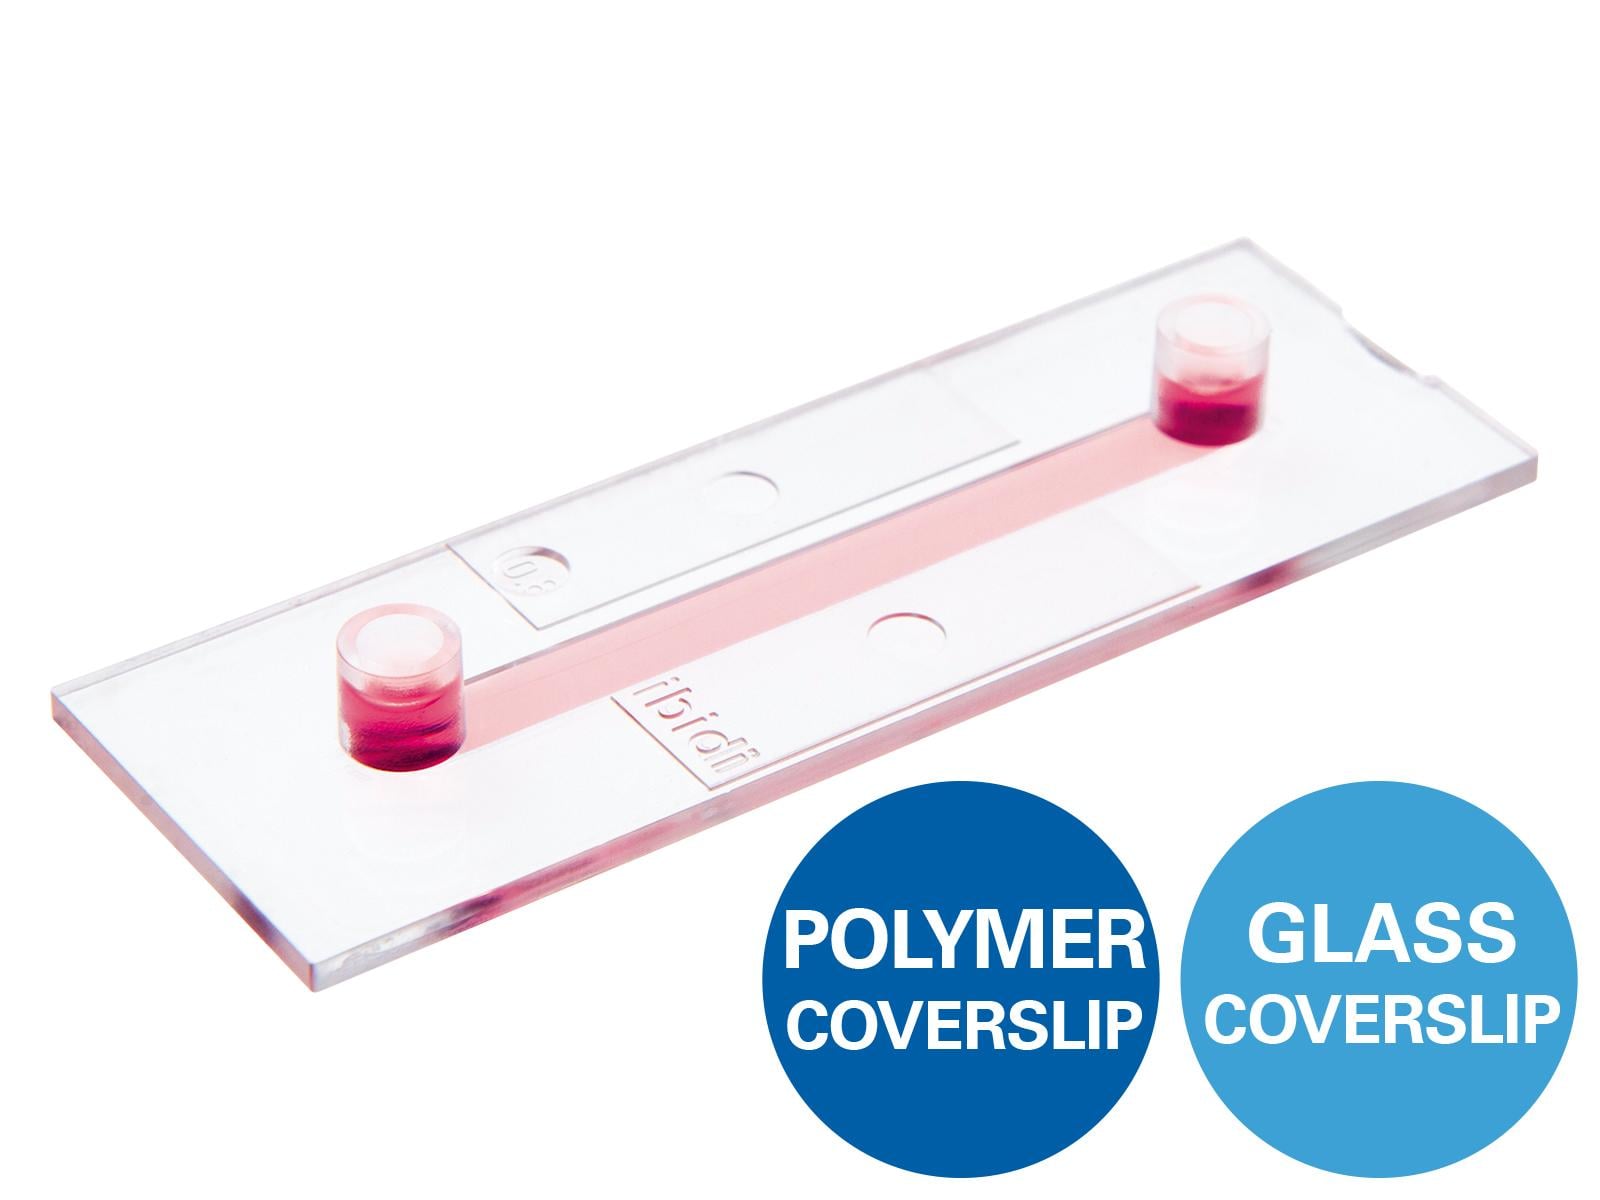
- Culture-Insert 2 Well (ibidi; 81176)
- Cell culture tubes
- Vortex
- Tweezers
- Light Microscope (Leica)
- Fluorescence Microscope (Nikon)
- NIS-Elements Software
3. Procedure (summarized in Figure 1)
- Both GFP-A375 and Tomato-fibroblast cell lines are stably kept in MEF culture medium at 37°C and 5% CO2 in a humidified incubator.
- When the cells reach subconfluency (around 80% confluence), wash them under a flow hood with PBS to remove dead cells and debris.
- Trypsinize cells with Trypsin-EDTA solution for about 5 minutes in the incubator, then add MEF medium to block the reaction.
- Collect cell suspension in 15 ml cell culture tubes and briefly centrifuge them with a bench centrifuge (1500xg, 5´, RT).
- Resuspend cell pellet in fresh culture medium; mix one volume of cell suspension with another volume of trypan blue solution and count live cells with a hemocytometer counting chamber.
- Dilute cells at the concentration of 4 x 10⁵ cell/ml in MEF buffer.
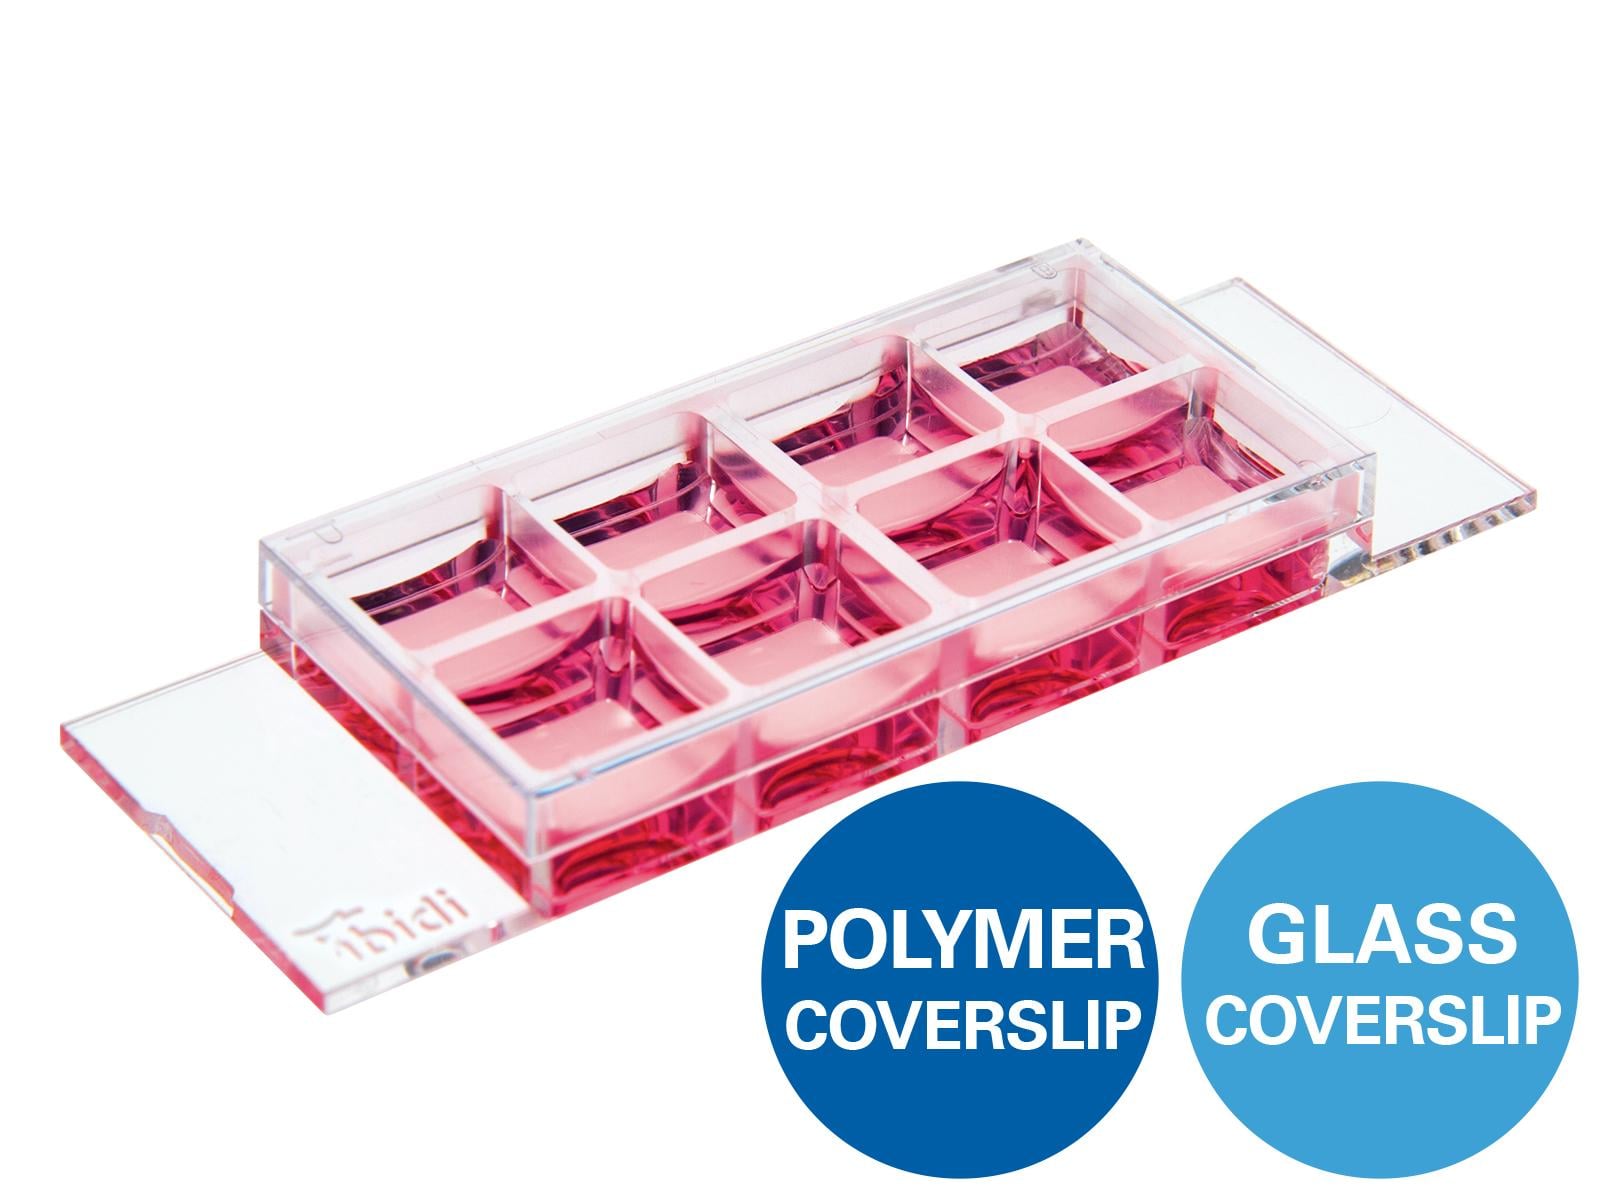
- In a multiwell plate, place a Culture-Insert 2 Well in the middle of each well (2 inserts per each condition).
- Fill one side of the insert with 75 µl (corresponding to 3 x 10⁴ cells) with GFP-A375 cells, and the other side with Tomato-fibroblast cells. Mix cells inside the inserts going up and down with a pipette to ensure a complete cell distribution.
- Place the multiwell plate in the incubator and leave it overnight.
- The following day, carefully remove culture medium and inserts from each well with the help of tweezers and wash with PBS.
- Carefully remove the PBS and add fresh MEF medium.
- Check the closure status of the gap generated between GFP-A375 and Tomato-fibroblast cells with a light microscope.
- As soon as the gap is completely closed in each well, acquire fluorescence images using a fluorescence microscope and an imaging software. Make sure that tumor cells have not yet invaded the fibroblast monolayer.
- Carefully remove culture medium and add medium + 0.1% DMSO in the control-group wells and medium + 300 nM Mithramycin A in the treated-group wells. Place the plate in the incubator for 24h (treatment incubation time).
- After 24h, re-acquire the co-cultured wells under the fluorescence microscope to assess any alterations in tumor cell invasive behavior in treated vs. control group (green fluorescent cells scattered across the red-labelled layer) (Figure 2).
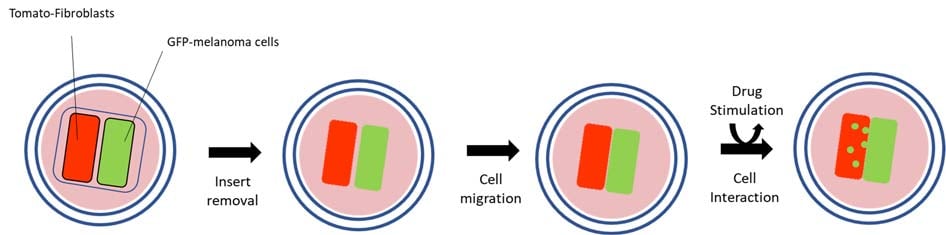
Figure 1. Schematic overview of the 2D invasion system.
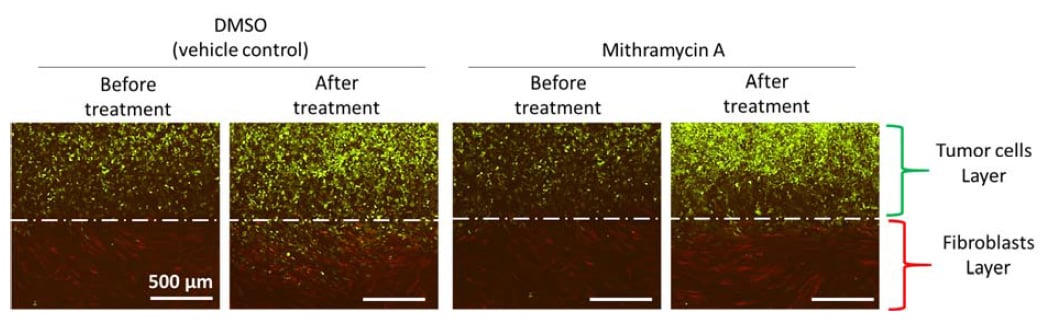
Figure 2. Fluorescent images of 2D invasion assays. Melanoma cells and fibroblasts were co-cultured and subsequently exposed to 300 nM Mithramycin A (or DMSO). After 24h, the number of tumor cells that have invaded the fibroblast layer was evaluated. A375 cells showed a massive invasive behavior, impaired by Mithramycin A treatment. Scale bar: 500 μm.
4. References
Mithramycin A and mithralog EC-8042 inhibit SETDB1 expression and its oncogenic activity in malignant melanoma. Federico A, Steinfass T, Larribère L, Novak D, Morís F, Núñez LE, Umansky V, Utikal J. Molecular Therapy-Oncolytics 2020; doi: https://doi.org/10.1016/j.omto.2020.06.001 (Method described in this protocol was included in this published article).
The impact of jamming on boundaries of collectively moving weak-interacting cells. Nnetu KD, Knorr M, Käs J, Zink M. New Journal of Physics 2012; doi: https://doi.org/10.1088/1367-2630/14/11/115012
Fibroblasts contribute to melanoma tumor growth and drug resistance. Flach EH, Rebecca VW, Herlyn M, Smalley KS, Anderson AR. Molecular Pharmaceutics 2011; doi: 10.1021/mp200421k
5. Notes
- MEF medium composition is described here (Reference 1).
This User Protocol is an ibidi peer-reviewed protocol from an actual user. ibidi does not guarantee its functionality or reproducibility. For this User Protocol, ibidi provides only limited support. Please contact the corresponding author for more information.
For research use only.